Syrian vs Immigrants from Croatia Single Father Households
COMPARE
Syrian
Immigrants from Croatia
Single Father Households
Single Father Households Comparison
Syrians
Immigrants from Croatia
2.2%
SINGLE FATHER HOUSEHOLDS
94.8/ 100
METRIC RATING
135th/ 347
METRIC RANK
2.0%
SINGLE FATHER HOUSEHOLDS
100.0/ 100
METRIC RATING
23rd/ 347
METRIC RANK
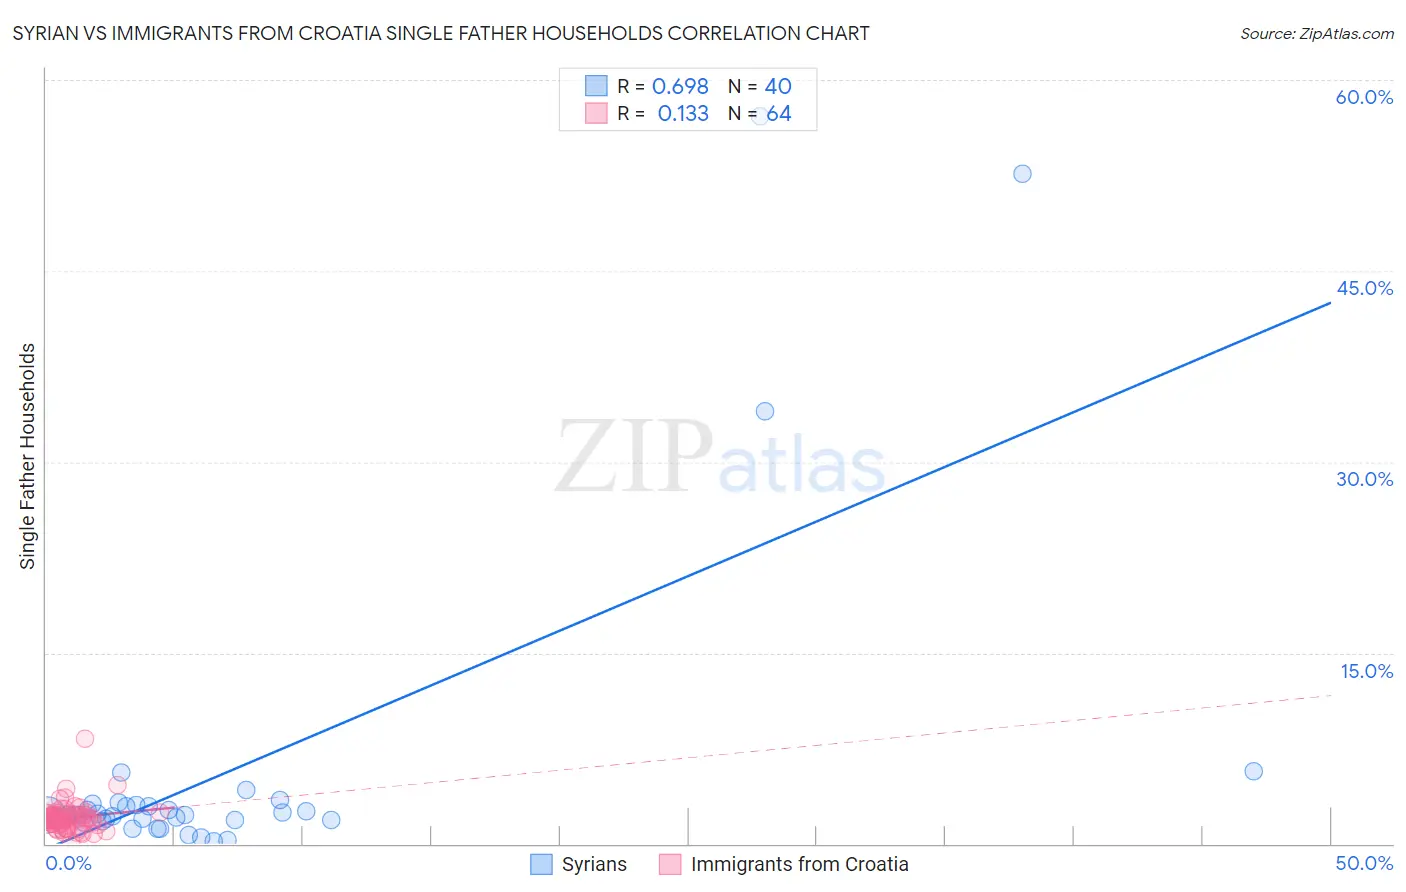
Syrian vs Immigrants from Croatia Single Father Households Correlation Chart
The statistical analysis conducted on geographies consisting of 264,617,959 people shows a significant positive correlation between the proportion of Syrians and percentage of single father households in the United States with a correlation coefficient (R) of 0.698 and weighted average of 2.2%. Similarly, the statistical analysis conducted on geographies consisting of 132,226,355 people shows a poor positive correlation between the proportion of Immigrants from Croatia and percentage of single father households in the United States with a correlation coefficient (R) of 0.133 and weighted average of 2.0%, a difference of 13.1%.
Single Father Households Correlation Summary
| Measurement | Syrian | Immigrants from Croatia |
| Minimum | 0.16% | 0.16% |
| Maximum | 57.1% | 8.2% |
| Range | 57.0% | 8.1% |
| Mean | 5.7% | 2.0% |
| Median | 2.2% | 2.0% |
| Interquartile 25% (IQ1) | 1.9% | 1.5% |
| Interquartile 75% (IQ3) | 3.0% | 2.3% |
| Interquartile Range (IQR) | 1.1% | 0.73% |
| Standard Deviation (Sample) | 12.5% | 1.1% |
| Standard Deviation (Population) | 12.4% | 1.1% |
Similar Demographics by Single Father Households
Demographics Similar to Syrians by Single Father Households
In terms of single father households, the demographic groups most similar to Syrians are Zimbabwean (2.2%, a difference of 0.11%), Chilean (2.2%, a difference of 0.12%), Austrian (2.2%, a difference of 0.23%), West Indian (2.2%, a difference of 0.26%), and Brazilian (2.2%, a difference of 0.68%).
| Demographics | Rating | Rank | Single Father Households |
| Immigrants | England | 96.8 /100 | #128 | Exceptional 2.2% |
| Serbians | 96.8 /100 | #129 | Exceptional 2.2% |
| Immigrants | Chile | 96.7 /100 | #130 | Exceptional 2.2% |
| Immigrants | Jordan | 96.6 /100 | #131 | Exceptional 2.2% |
| Poles | 96.5 /100 | #132 | Exceptional 2.2% |
| Taiwanese | 96.3 /100 | #133 | Exceptional 2.2% |
| Zimbabweans | 95.1 /100 | #134 | Exceptional 2.2% |
| Syrians | 94.8 /100 | #135 | Exceptional 2.2% |
| Chileans | 94.5 /100 | #136 | Exceptional 2.2% |
| Austrians | 94.2 /100 | #137 | Exceptional 2.2% |
| West Indians | 94.1 /100 | #138 | Exceptional 2.2% |
| Brazilians | 92.8 /100 | #139 | Exceptional 2.2% |
| British | 92.8 /100 | #140 | Exceptional 2.2% |
| Laotians | 92.5 /100 | #141 | Exceptional 2.2% |
| Luxembourgers | 92.3 /100 | #142 | Exceptional 2.2% |
Demographics Similar to Immigrants from Croatia by Single Father Households
In terms of single father households, the demographic groups most similar to Immigrants from Croatia are Immigrants from Russia (2.0%, a difference of 0.0%), Eastern European (2.0%, a difference of 0.010%), Assyrian/Chaldean/Syriac (2.0%, a difference of 0.15%), Immigrants from South Central Asia (2.0%, a difference of 0.43%), and Immigrants from Japan (2.0%, a difference of 0.61%).
| Demographics | Rating | Rank | Single Father Households |
| Immigrants | Iran | 100.0 /100 | #16 | Exceptional 1.9% |
| Immigrants | India | 100.0 /100 | #17 | Exceptional 1.9% |
| Indians (Asian) | 100.0 /100 | #18 | Exceptional 1.9% |
| Iranians | 100.0 /100 | #19 | Exceptional 1.9% |
| Thais | 100.0 /100 | #20 | Exceptional 1.9% |
| Immigrants | Albania | 100.0 /100 | #21 | Exceptional 1.9% |
| Immigrants | Latvia | 100.0 /100 | #22 | Exceptional 1.9% |
| Immigrants | Croatia | 100.0 /100 | #23 | Exceptional 2.0% |
| Immigrants | Russia | 100.0 /100 | #24 | Exceptional 2.0% |
| Eastern Europeans | 100.0 /100 | #25 | Exceptional 2.0% |
| Assyrians/Chaldeans/Syriacs | 100.0 /100 | #26 | Exceptional 2.0% |
| Immigrants | South Central Asia | 100.0 /100 | #27 | Exceptional 2.0% |
| Immigrants | Japan | 100.0 /100 | #28 | Exceptional 2.0% |
| Bulgarians | 100.0 /100 | #29 | Exceptional 2.0% |
| Cambodians | 100.0 /100 | #30 | Exceptional 2.0% |