Syrian vs Immigrants from Croatia Unemployment Among Seniors over 65 years
COMPARE
Syrian
Immigrants from Croatia
Unemployment Among Seniors over 65 years
Unemployment Among Seniors over 65 years Comparison
Syrians
Immigrants from Croatia
5.1%
UNEMPLOYMENT AMONG SENIORS OVER 65 YEARS
85.3/ 100
METRIC RATING
133rd/ 347
METRIC RANK
5.3%
UNEMPLOYMENT AMONG SENIORS OVER 65 YEARS
5.3/ 100
METRIC RATING
226th/ 347
METRIC RANK
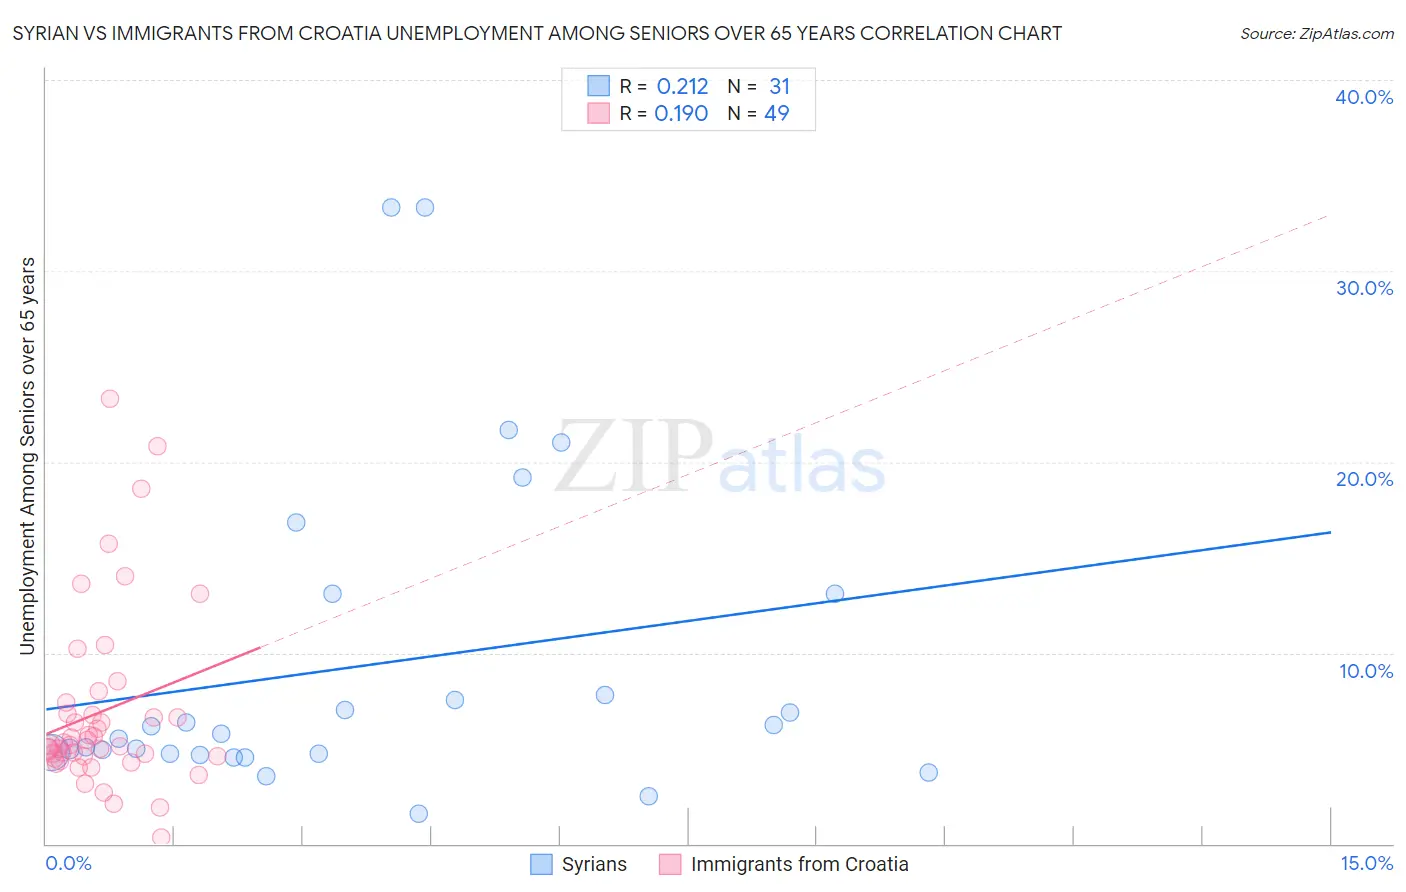
Syrian vs Immigrants from Croatia Unemployment Among Seniors over 65 years Correlation Chart
The statistical analysis conducted on geographies consisting of 249,290,936 people shows a weak positive correlation between the proportion of Syrians and unemployment rate amomg seniors over the age of 65 in the United States with a correlation coefficient (R) of 0.212 and weighted average of 5.1%. Similarly, the statistical analysis conducted on geographies consisting of 127,174,177 people shows a poor positive correlation between the proportion of Immigrants from Croatia and unemployment rate amomg seniors over the age of 65 in the United States with a correlation coefficient (R) of 0.190 and weighted average of 5.3%, a difference of 3.8%.
Unemployment Among Seniors over 65 years Correlation Summary
| Measurement | Syrian | Immigrants from Croatia |
| Minimum | 1.6% | 0.30% |
| Maximum | 33.3% | 23.3% |
| Range | 31.7% | 23.0% |
| Mean | 9.4% | 6.9% |
| Median | 5.8% | 5.2% |
| Interquartile 25% (IQ1) | 4.7% | 4.5% |
| Interquartile 75% (IQ3) | 13.1% | 7.1% |
| Interquartile Range (IQR) | 8.4% | 2.6% |
| Standard Deviation (Sample) | 8.3% | 4.7% |
| Standard Deviation (Population) | 8.2% | 4.7% |
Similar Demographics by Unemployment Among Seniors over 65 years
Demographics Similar to Syrians by Unemployment Among Seniors over 65 years
In terms of unemployment among seniors over 65 years, the demographic groups most similar to Syrians are Chilean (5.1%, a difference of 0.020%), Immigrants from Australia (5.1%, a difference of 0.030%), Turkish (5.1%, a difference of 0.030%), Ukrainian (5.1%, a difference of 0.050%), and White/Caucasian (5.1%, a difference of 0.060%).
| Demographics | Rating | Rank | Unemployment Among Seniors over 65 years |
| Immigrants | Sri Lanka | 87.4 /100 | #126 | Excellent 5.1% |
| Sri Lankans | 87.4 /100 | #127 | Excellent 5.1% |
| Australians | 87.1 /100 | #128 | Excellent 5.1% |
| Immigrants | England | 86.7 /100 | #129 | Excellent 5.1% |
| Iranians | 86.6 /100 | #130 | Excellent 5.1% |
| Immigrants | Australia | 85.8 /100 | #131 | Excellent 5.1% |
| Chileans | 85.6 /100 | #132 | Excellent 5.1% |
| Syrians | 85.3 /100 | #133 | Excellent 5.1% |
| Turks | 84.9 /100 | #134 | Excellent 5.1% |
| Ukrainians | 84.4 /100 | #135 | Excellent 5.1% |
| Whites/Caucasians | 84.4 /100 | #136 | Excellent 5.1% |
| Arabs | 84.3 /100 | #137 | Excellent 5.1% |
| New Zealanders | 83.2 /100 | #138 | Excellent 5.1% |
| Immigrants | Panama | 83.0 /100 | #139 | Excellent 5.1% |
| Immigrants | Chile | 83.0 /100 | #140 | Excellent 5.1% |
Demographics Similar to Immigrants from Croatia by Unemployment Among Seniors over 65 years
In terms of unemployment among seniors over 65 years, the demographic groups most similar to Immigrants from Croatia are French American Indian (5.3%, a difference of 0.010%), Immigrants from Syria (5.3%, a difference of 0.050%), Honduran (5.3%, a difference of 0.050%), Cree (5.3%, a difference of 0.070%), and Israeli (5.3%, a difference of 0.13%).
| Demographics | Rating | Rank | Unemployment Among Seniors over 65 years |
| Dutch West Indians | 6.9 /100 | #219 | Tragic 5.3% |
| Egyptians | 6.4 /100 | #220 | Tragic 5.3% |
| Arapaho | 6.3 /100 | #221 | Tragic 5.3% |
| Israelis | 6.2 /100 | #222 | Tragic 5.3% |
| Cree | 5.8 /100 | #223 | Tragic 5.3% |
| Immigrants | Syria | 5.6 /100 | #224 | Tragic 5.3% |
| Hondurans | 5.6 /100 | #225 | Tragic 5.3% |
| Immigrants | Croatia | 5.3 /100 | #226 | Tragic 5.3% |
| French American Indians | 5.2 /100 | #227 | Tragic 5.3% |
| Haitians | 4.4 /100 | #228 | Tragic 5.3% |
| Samoans | 4.2 /100 | #229 | Tragic 5.3% |
| Immigrants | Argentina | 4.0 /100 | #230 | Tragic 5.3% |
| Hungarians | 3.9 /100 | #231 | Tragic 5.3% |
| Hopi | 3.5 /100 | #232 | Tragic 5.3% |
| Marshallese | 3.1 /100 | #233 | Tragic 5.3% |