Austrian vs Immigrants from Croatia Median Household Income
COMPARE
Austrian
Immigrants from Croatia
Median Household Income
Median Household Income Comparison
Austrians
Immigrants from Croatia
$91,339
MEDIAN HOUSEHOLD INCOME
98.2/ 100
METRIC RATING
102nd/ 347
METRIC RANK
$92,225
MEDIAN HOUSEHOLD INCOME
99.0/ 100
METRIC RATING
85th/ 347
METRIC RANK
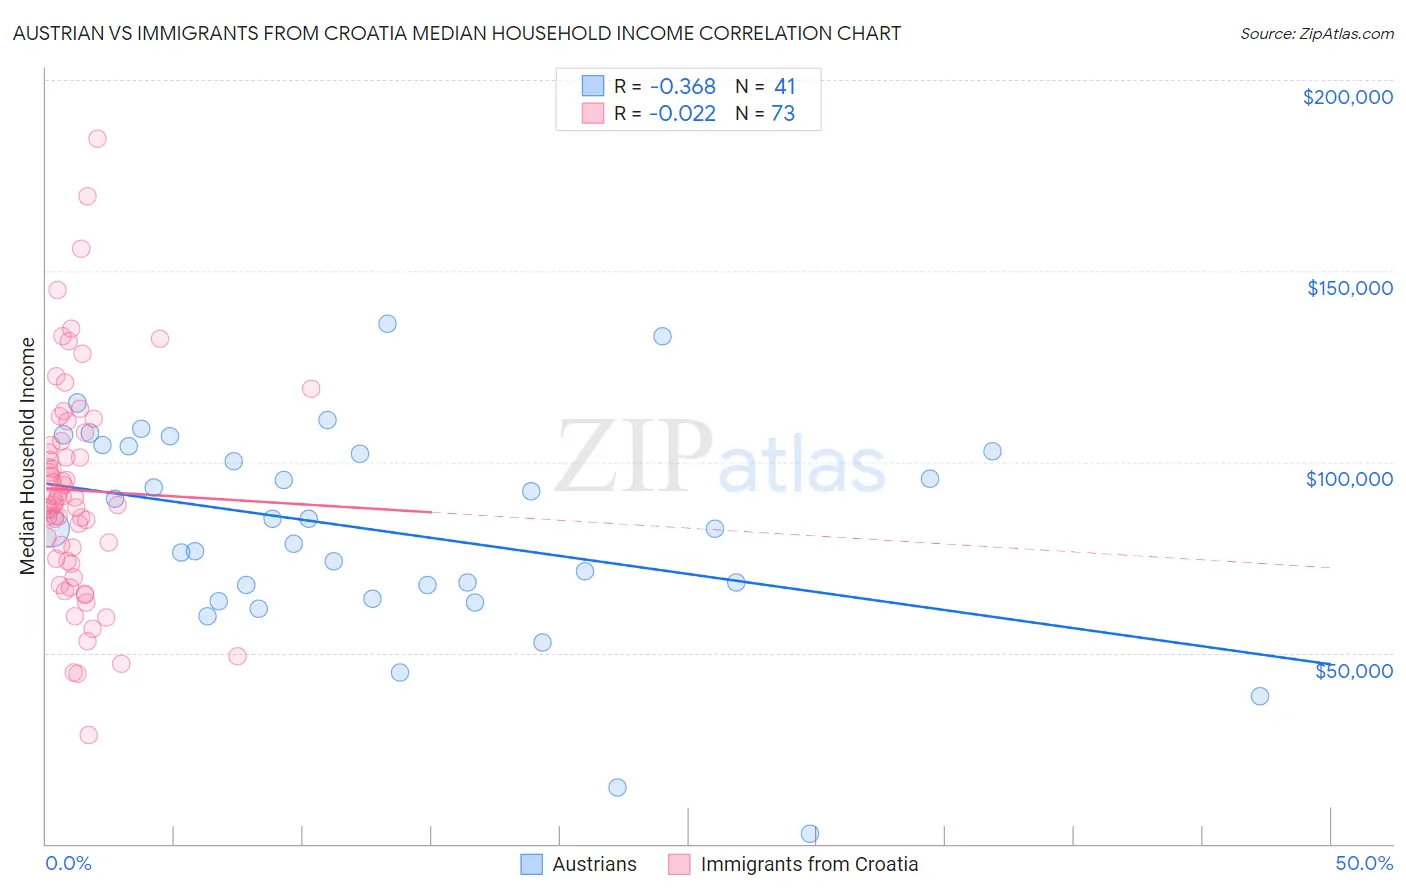
Austrian vs Immigrants from Croatia Median Household Income Correlation Chart
The statistical analysis conducted on geographies consisting of 451,682,607 people shows a mild negative correlation between the proportion of Austrians and median household income in the United States with a correlation coefficient (R) of -0.368 and weighted average of $91,339. Similarly, the statistical analysis conducted on geographies consisting of 132,561,989 people shows no correlation between the proportion of Immigrants from Croatia and median household income in the United States with a correlation coefficient (R) of -0.022 and weighted average of $92,225, a difference of 0.97%.
Median Household Income Correlation Summary
| Measurement | Austrian | Immigrants from Croatia |
| Minimum | $2,499 | $28,542 |
| Maximum | $136,149 | $184,569 |
| Range | $133,650 | $156,027 |
| Mean | $81,843 | $92,543 |
| Median | $82,650 | $90,687 |
| Interquartile 25% (IQ1) | $65,934 | $74,217 |
| Interquartile 75% (IQ3) | $103,488 | $106,459 |
| Interquartile Range (IQR) | $37,555 | $32,243 |
| Standard Deviation (Sample) | $27,786 | $28,654 |
| Standard Deviation (Population) | $27,445 | $28,457 |
Demographics Similar to Austrians and Immigrants from Croatia by Median Household Income
In terms of median household income, the demographic groups most similar to Austrians are Immigrants from Moldova ($91,446, a difference of 0.12%), Ukrainian ($91,456, a difference of 0.13%), Immigrants from South Eastern Asia ($91,541, a difference of 0.22%), Immigrants from Ukraine ($91,124, a difference of 0.24%), and Immigrants from Southern Europe ($91,605, a difference of 0.29%). Similarly, the demographic groups most similar to Immigrants from Croatia are Immigrants from England ($92,098, a difference of 0.14%), Immigrants from Hungary ($92,094, a difference of 0.14%), Immigrants from Argentina ($92,417, a difference of 0.21%), Immigrants from Canada ($92,029, a difference of 0.21%), and Romanian ($91,994, a difference of 0.25%).
| Demographics | Rating | Rank | Median Household Income |
| Italians | 99.1 /100 | #83 | Exceptional $92,475 |
| Immigrants | Argentina | 99.1 /100 | #84 | Exceptional $92,417 |
| Immigrants | Croatia | 99.0 /100 | #85 | Exceptional $92,225 |
| Immigrants | England | 98.9 /100 | #86 | Exceptional $92,098 |
| Immigrants | Hungary | 98.9 /100 | #87 | Exceptional $92,094 |
| Immigrants | Canada | 98.8 /100 | #88 | Exceptional $92,029 |
| Romanians | 98.8 /100 | #89 | Exceptional $91,994 |
| Assyrians/Chaldeans/Syriacs | 98.8 /100 | #90 | Exceptional $91,991 |
| Immigrants | Vietnam | 98.8 /100 | #91 | Exceptional $91,987 |
| Immigrants | Western Europe | 98.8 /100 | #92 | Exceptional $91,936 |
| Immigrants | Lebanon | 98.7 /100 | #93 | Exceptional $91,887 |
| Immigrants | North America | 98.7 /100 | #94 | Exceptional $91,860 |
| Armenians | 98.7 /100 | #95 | Exceptional $91,807 |
| Jordanians | 98.7 /100 | #96 | Exceptional $91,794 |
| Immigrants | Serbia | 98.6 /100 | #97 | Exceptional $91,730 |
| Immigrants | Southern Europe | 98.5 /100 | #98 | Exceptional $91,605 |
| Immigrants | South Eastern Asia | 98.4 /100 | #99 | Exceptional $91,541 |
| Ukrainians | 98.3 /100 | #100 | Exceptional $91,456 |
| Immigrants | Moldova | 98.3 /100 | #101 | Exceptional $91,446 |
| Austrians | 98.2 /100 | #102 | Exceptional $91,339 |
| Immigrants | Ukraine | 98.0 /100 | #103 | Exceptional $91,124 |