Irish vs Immigrants from Croatia Median Household Income
COMPARE
Irish
Immigrants from Croatia
Median Household Income
Median Household Income Comparison
Irish
Immigrants from Croatia
$86,145
MEDIAN HOUSEHOLD INCOME
66.2/ 100
METRIC RATING
164th/ 347
METRIC RANK
$92,225
MEDIAN HOUSEHOLD INCOME
99.0/ 100
METRIC RATING
85th/ 347
METRIC RANK
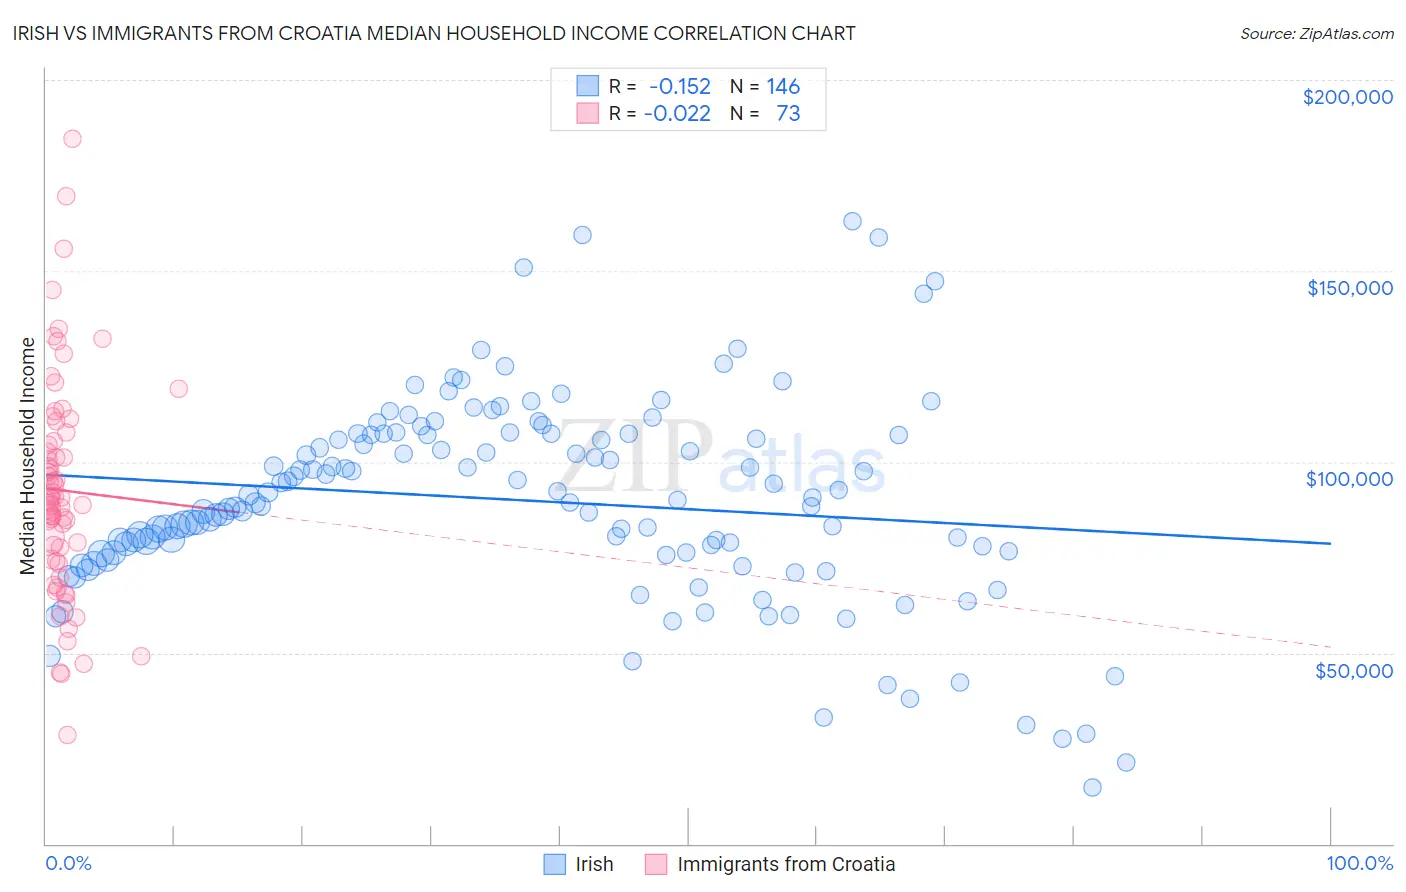
Irish vs Immigrants from Croatia Median Household Income Correlation Chart
The statistical analysis conducted on geographies consisting of 579,055,037 people shows a poor negative correlation between the proportion of Irish and median household income in the United States with a correlation coefficient (R) of -0.152 and weighted average of $86,145. Similarly, the statistical analysis conducted on geographies consisting of 132,561,989 people shows no correlation between the proportion of Immigrants from Croatia and median household income in the United States with a correlation coefficient (R) of -0.022 and weighted average of $92,225, a difference of 7.1%.
Median Household Income Correlation Summary
| Measurement | Irish | Immigrants from Croatia |
| Minimum | $14,837 | $28,542 |
| Maximum | $162,948 | $184,569 |
| Range | $148,111 | $156,027 |
| Mean | $89,921 | $92,543 |
| Median | $89,704 | $90,687 |
| Interquartile 25% (IQ1) | $76,304 | $74,217 |
| Interquartile 75% (IQ3) | $107,042 | $106,459 |
| Interquartile Range (IQR) | $30,738 | $32,243 |
| Standard Deviation (Sample) | $26,625 | $28,654 |
| Standard Deviation (Population) | $26,534 | $28,457 |
Similar Demographics by Median Household Income
Demographics Similar to Irish by Median Household Income
In terms of median household income, the demographic groups most similar to Irish are Czech ($86,164, a difference of 0.020%), Norwegian ($86,084, a difference of 0.070%), Scandinavian ($86,073, a difference of 0.080%), Guamanian/Chamorro ($86,255, a difference of 0.13%), and Slavic ($86,398, a difference of 0.29%).
| Demographics | Rating | Rank | Median Household Income |
| Samoans | 71.0 /100 | #157 | Good $86,498 |
| Moroccans | 70.6 /100 | #158 | Good $86,468 |
| Immigrants | Uzbekistan | 70.1 /100 | #159 | Good $86,425 |
| Luxembourgers | 70.0 /100 | #160 | Good $86,418 |
| Slavs | 69.7 /100 | #161 | Good $86,398 |
| Guamanians/Chamorros | 67.7 /100 | #162 | Good $86,255 |
| Czechs | 66.4 /100 | #163 | Good $86,164 |
| Irish | 66.2 /100 | #164 | Good $86,145 |
| Norwegians | 65.3 /100 | #165 | Good $86,084 |
| Scandinavians | 65.1 /100 | #166 | Good $86,073 |
| Immigrants | Immigrants | 61.3 /100 | #167 | Good $85,818 |
| Icelanders | 61.0 /100 | #168 | Good $85,797 |
| Colombians | 59.7 /100 | #169 | Average $85,716 |
| Swiss | 59.2 /100 | #170 | Average $85,681 |
| Immigrants | South America | 58.1 /100 | #171 | Average $85,611 |
Demographics Similar to Immigrants from Croatia by Median Household Income
In terms of median household income, the demographic groups most similar to Immigrants from Croatia are Immigrants from England ($92,098, a difference of 0.14%), Immigrants from Hungary ($92,094, a difference of 0.14%), Immigrants from Argentina ($92,417, a difference of 0.21%), Immigrants from Canada ($92,029, a difference of 0.21%), and Romanian ($91,994, a difference of 0.25%).
| Demographics | Rating | Rank | Median Household Income |
| Immigrants | Bulgaria | 99.4 /100 | #78 | Exceptional $93,148 |
| Sri Lankans | 99.4 /100 | #79 | Exceptional $93,093 |
| Tongans | 99.4 /100 | #80 | Exceptional $93,076 |
| Immigrants | Eastern Europe | 99.4 /100 | #81 | Exceptional $93,051 |
| Immigrants | Spain | 99.3 /100 | #82 | Exceptional $92,732 |
| Italians | 99.1 /100 | #83 | Exceptional $92,475 |
| Immigrants | Argentina | 99.1 /100 | #84 | Exceptional $92,417 |
| Immigrants | Croatia | 99.0 /100 | #85 | Exceptional $92,225 |
| Immigrants | England | 98.9 /100 | #86 | Exceptional $92,098 |
| Immigrants | Hungary | 98.9 /100 | #87 | Exceptional $92,094 |
| Immigrants | Canada | 98.8 /100 | #88 | Exceptional $92,029 |
| Romanians | 98.8 /100 | #89 | Exceptional $91,994 |
| Assyrians/Chaldeans/Syriacs | 98.8 /100 | #90 | Exceptional $91,991 |
| Immigrants | Vietnam | 98.8 /100 | #91 | Exceptional $91,987 |
| Immigrants | Western Europe | 98.8 /100 | #92 | Exceptional $91,936 |