Immigrants from Kenya vs Immigrants from Croatia Median Earnings

COMPARE

Immigrants from Kenya
Race
Ancestry
AfghanAfricanAlaska NativeAlaskan AthabascanAlbanianAleutAlsatianAmericanApacheArabArapahoArgentineanArmenianAssyrian/Chaldean/SyriacAustralianAustrianBahamianBangladeshiBarbadianBasqueBelgianBelizeanBermudanBhutaneseBlackfeetBolivianBrazilianBritishBritish West IndianBulgarianBurmeseCajunCambodianCanadianCape VerdeanCarpatho RusynCelticCentral AmericanCentral American IndianCherokeeCheyenneChickasawChileanChineseChippewaChoctawColombianColvilleComancheCosta RicanCreeCreekCroatianCrowCubanCypriotCzechCzechoslovakianDanishDelawareDominicanDutchDutch West IndianEastern EuropeanEcuadorianEgyptianEnglishEstonianEthiopianEuropeanFijianFilipinoFinnishFrenchFrench American IndianFrench CanadianGermanGerman RussianGhanaianGreekGuamanian/ChamorroGuatemalanGuyaneseHaitianHmongHonduranHopiHoumaHungarianIcelanderIndian (Asian)IndonesianInupiatIranianIraqiIrishIroquoisIsraeliItalianJamaicanJapaneseJordanianKenyanKiowaKoreanLaotianLatvianLebaneseLiberianLithuanianLumbeeLuxembourgerMacedonianMalaysianMalteseMarshalleseMenomineeMexicanMexican American IndianMongolianMoroccanNative HawaiianNavajoNepaleseNew ZealanderNicaraguanNigerianNorthern EuropeanNorwegianOkinawanOsageOttawaPaiutePakistaniPalestinianPanamanianParaguayanPennsylvania GermanPeruvianPimaPolishPortuguesePotawatomiPuebloPuerto RicanPuget Sound SalishRomanianRussianSalvadoranSamoanScandinavianScotch-IrishScottishSeminoleSenegaleseSerbianShoshoneSierra LeoneanSiouxSlavicSlovakSloveneSomaliSouth AfricanSouth AmericanSouth American IndianSoviet UnionSpaniardSpanishSpanish AmericanSpanish American IndianSri LankanSubsaharan AfricanSudaneseSwedishSwissSyrianTaiwaneseThaiTlingit-HaidaTohono O'OdhamTonganTrinidadian and TobagonianTsimshianTurkishU.S. Virgin IslanderUgandanUkrainianUruguayanUteVenezuelanVietnameseWelshWest IndianYakamaYaquiYugoslavianYumanYup'ikZimbabwean
Immigration
NonimmigrantsImmigrantsAfghanistanAfricaAlbaniaArgentinaArmeniaAsiaAustraliaAustriaBahamasBangladeshBarbadosBelarusBelgiumBelizeBoliviaBosnia and HerzegovinaBrazilBulgariaBurma/MyanmarCabo VerdeCambodiaCameroonCanadaCaribbeanCentral AmericaChileChinaColombiaCongoCosta RicaCubaCzechoslovakiaDenmarkDominicaDominican RepublicEastern AfricaEastern AsiaEastern EuropeEcuadorEgyptEl SalvadorEnglandEritreaEthiopiaEuropeFijiFranceGermanyGhanaGreeceGrenadaGuatemalaGuyanaHaitiHondurasHong KongHungaryIndiaIndonesiaIranIraqIrelandIsraelItalyJamaicaJapanJordanKazakhstanKenyaKoreaKuwaitLaosLatin AmericaLatviaLebanonLiberiaLithuaniaMalaysiaMexicoMicronesiaMiddle AfricaMoldovaMoroccoNepalNetherlandsNicaraguaNigeriaNorth AmericaNorth MacedoniaNorthern AfricaNorthern EuropeNorwayOceaniaPakistanPanamaPeruPhilippinesPolandPortugalRomaniaRussiaSaudi ArabiaScotlandSenegalSerbiaSierra LeoneSingaporeSomaliaSouth AfricaSouth AmericaSouth Central AsiaSouth Eastern AsiaSouthern EuropeSpainSri LankaSt. Vincent and the GrenadinesSudanSwedenSwitzerlandSyriaTaiwanThailandTrinidad and TobagoTurkeyUgandaUkraineUruguayUzbekistanVenezuelaVietnamWest IndiesWestern AfricaWestern AsiaWestern EuropeYemenZaireZimbabweAzores
Immigrants from Croatia
Race
Ancestry
AfghanAfricanAlaska NativeAlaskan AthabascanAlbanianAleutAlsatianAmericanApacheArabArapahoArgentineanArmenianAssyrian/Chaldean/SyriacAustralianAustrianBahamianBangladeshiBarbadianBasqueBelgianBelizeanBermudanBhutaneseBlackfeetBolivianBrazilianBritishBritish West IndianBulgarianBurmeseCajunCambodianCanadianCape VerdeanCarpatho RusynCelticCentral AmericanCentral American IndianCherokeeCheyenneChickasawChileanChineseChippewaChoctawColombianColvilleComancheCosta RicanCreeCreekCroatianCrowCubanCypriotCzechCzechoslovakianDanishDelawareDominicanDutchDutch West IndianEastern EuropeanEcuadorianEgyptianEnglishEstonianEthiopianEuropeanFijianFilipinoFinnishFrenchFrench American IndianFrench CanadianGermanGerman RussianGhanaianGreekGuamanian/ChamorroGuatemalanGuyaneseHaitianHmongHonduranHopiHoumaHungarianIcelanderIndian (Asian)IndonesianInupiatIranianIraqiIrishIroquoisIsraeliItalianJamaicanJapaneseJordanianKenyanKiowaKoreanLaotianLatvianLebaneseLiberianLithuanianLumbeeLuxembourgerMacedonianMalaysianMalteseMarshalleseMenomineeMexicanMexican American IndianMongolianMoroccanNative HawaiianNavajoNepaleseNew ZealanderNicaraguanNigerianNorthern EuropeanNorwegianOkinawanOsageOttawaPaiutePakistaniPalestinianPanamanianParaguayanPennsylvania GermanPeruvianPimaPolishPortuguesePotawatomiPuebloPuerto RicanPuget Sound SalishRomanianRussianSalvadoranSamoanScandinavianScotch-IrishScottishSeminoleSenegaleseSerbianShoshoneSierra LeoneanSiouxSlavicSlovakSloveneSomaliSouth AfricanSouth AmericanSouth American IndianSoviet UnionSpaniardSpanishSpanish AmericanSpanish American IndianSri LankanSubsaharan AfricanSudaneseSwedishSwissSyrianTaiwaneseThaiTlingit-HaidaTohono O'OdhamTonganTrinidadian and TobagonianTsimshianTurkishU.S. Virgin IslanderUgandanUkrainianUruguayanUteVenezuelanVietnameseWelshWest IndianYakamaYaquiYugoslavianYumanYup'ikZimbabwean
Immigration
NonimmigrantsImmigrantsAfghanistanAfricaAlbaniaArgentinaArmeniaAsiaAustraliaAustriaBahamasBangladeshBarbadosBelarusBelgiumBelizeBoliviaBosnia and HerzegovinaBrazilBulgariaBurma/MyanmarCabo VerdeCambodiaCameroonCanadaCaribbeanCentral AmericaChileChinaColombiaCongoCosta RicaCroatiaCubaCzechoslovakiaDenmarkDominicaDominican RepublicEastern AfricaEastern AsiaEastern EuropeEcuadorEgyptEl SalvadorEnglandEritreaEthiopiaEuropeFijiFranceGermanyGhanaGreeceGrenadaGuatemalaGuyanaHaitiHondurasHong KongHungaryIndiaIndonesiaIranIraqIrelandIsraelItalyJamaicaJapanJordanKazakhstanKoreaKuwaitLaosLatin AmericaLatviaLebanonLiberiaLithuaniaMalaysiaMexicoMicronesiaMiddle AfricaMoldovaMoroccoNepalNetherlandsNicaraguaNigeriaNorth AmericaNorth MacedoniaNorthern AfricaNorthern EuropeNorwayOceaniaPakistanPanamaPeruPhilippinesPolandPortugalRomaniaRussiaSaudi ArabiaScotlandSenegalSerbiaSierra LeoneSingaporeSomaliaSouth AfricaSouth AmericaSouth Central AsiaSouth Eastern AsiaSouthern EuropeSpainSri LankaSt. Vincent and the GrenadinesSudanSwedenSwitzerlandSyriaTaiwanThailandTrinidad and TobagoTurkeyUgandaUkraineUruguayUzbekistanVenezuelaVietnamWest IndiesWestern AfricaWestern AsiaWestern EuropeYemenZaireZimbabweAzores
Median Earnings
Income
Poverty
Unemployment
Labor Participation
Family Structure
Vehicle Availability
Education Level
Disability

Median Earnings Comparison

Immigrants from Kenya

Immigrants from Croatia

Average
Exceptional
$46,214
MEDIAN EARNINGS
42.4/ 100
METRIC RATING
184th/ 347
METRIC RANK
$51,581
MEDIAN EARNINGS
99.9/ 100
METRIC RATING
59th/ 347
METRIC RANK

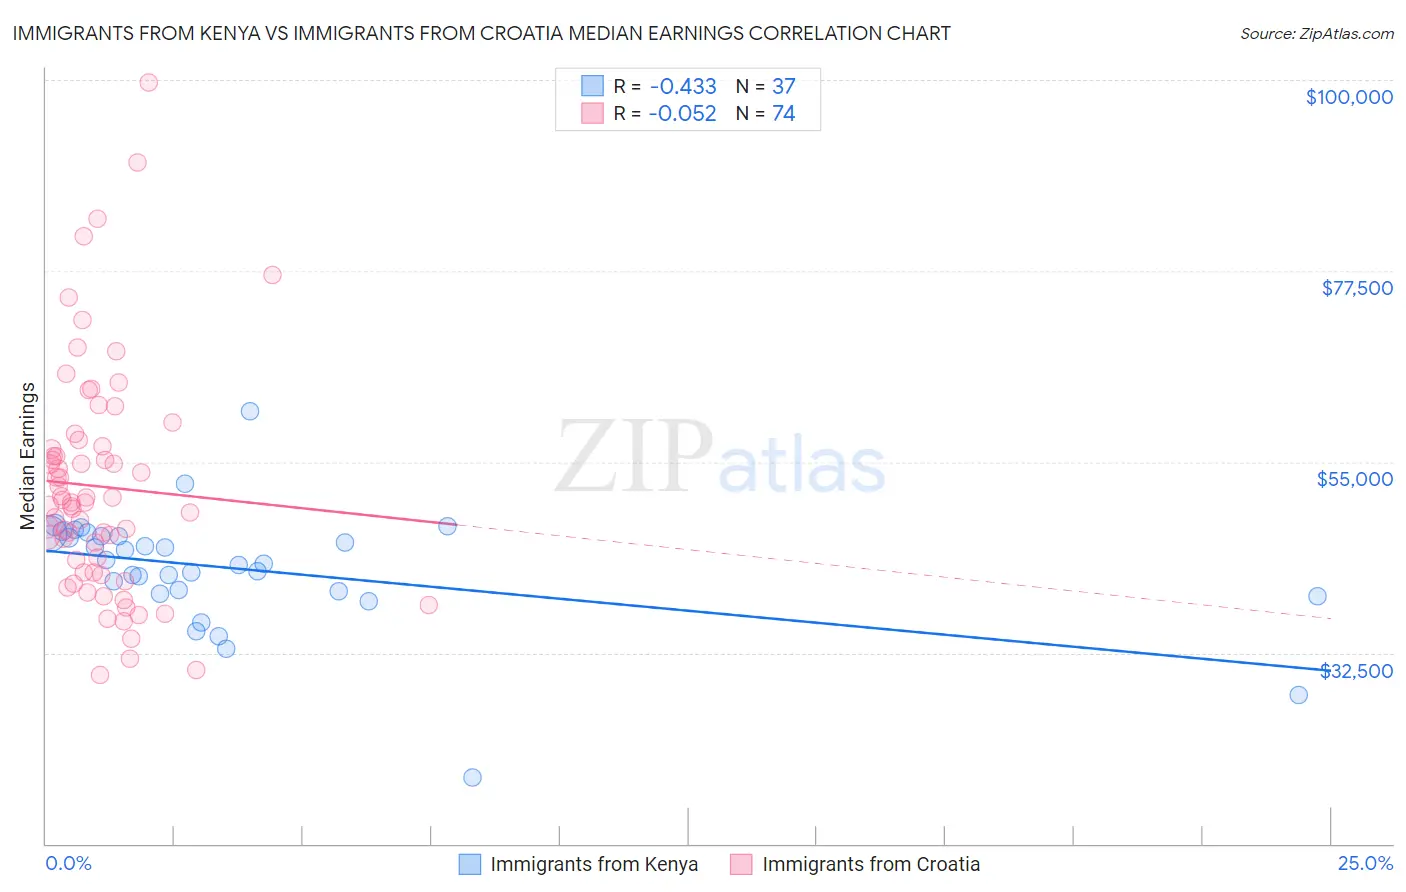
Immigrants from Kenya vs Immigrants from Croatia Median Earnings Correlation Chart

The statistical analysis conducted on geographies consisting of 218,063,953 people shows a moderate negative correlation between the proportion of Immigrants from Kenya and median earnings in the United States with a correlation coefficient (R) of -0.433 and weighted average of $46,214. Similarly, the statistical analysis conducted on geographies consisting of 132,573,888 people shows a slight negative correlation between the proportion of Immigrants from Croatia and median earnings in the United States with a correlation coefficient (R) of -0.052 and weighted average of $51,581, a difference of 11.6%.
Immigrants from Kenya vs Immigrants from Croatia Median Earnings

Median Earnings Correlation Summary

MeasurementImmigrants from KenyaImmigrants from Croatia
Minimum$17,794$29,868
Maximum$60,938$99,706
Range$43,144$69,838
Mean$42,338$52,095
Median$42,995$50,253
Interquartile 25% (IQ1)$39,646$41,915
Interquartile 75% (IQ3)$46,440$56,902
Interquartile Range (IQR)$6,794$14,987
Standard Deviation (Sample)$7,069$13,541
Standard Deviation (Population)$6,973$13,449

Similar Demographics by Median Earnings

Demographics Similar to Immigrants from Kenya by Median Earnings

In terms of median earnings, the demographic groups most similar to Immigrants from Kenya are Uruguayan ($46,190, a difference of 0.050%), Vietnamese ($46,172, a difference of 0.090%), Iraqi ($46,140, a difference of 0.16%), French ($46,296, a difference of 0.18%), and Swiss ($46,315, a difference of 0.22%).
DemographicsRating | RankMedian Earnings
Belgians
48.0
/100
|
#177
Average
$46,375
Colombians
47.1
/100
|
#178
Average
$46,349
English
46.5
/100
|
#179
Average
$46,334
Puget Sound Salish
46.5
/100
|
#180
Average
$46,333
Immigrants | Cameroon
46.4
/100
|
#181
Average
$46,329
Swiss
45.9
/100
|
#182
Average
$46,315
French
45.2
/100
|
#183
Average
$46,296
Immigrants | Kenya
42.4
/100
|
#184
Average
$46,214
Uruguayans
41.6
/100
|
#185
Average
$46,190
Vietnamese
40.9
/100
|
#186
Average
$46,172
Iraqis
39.9
/100
|
#187
Fair
$46,140
Immigrants | Armenia
38.3
/100
|
#188
Fair
$46,094
Spaniards
37.2
/100
|
#189
Fair
$46,059
French Canadians
36.1
/100
|
#190
Fair
$46,026
Finns
33.4
/100
|
#191
Fair
$45,940

Demographics Similar to Immigrants from Croatia by Median Earnings

In terms of median earnings, the demographic groups most similar to Immigrants from Croatia are Immigrants from Bolivia ($51,605, a difference of 0.050%), Immigrants from Serbia ($51,557, a difference of 0.050%), Immigrants from Latvia ($51,555, a difference of 0.050%), Immigrants from Eastern Europe ($51,624, a difference of 0.080%), and Immigrants from Pakistan ($51,693, a difference of 0.22%).
DemographicsRating | RankMedian Earnings
Estonians
99.9
/100
|
#52
Exceptional
$51,772
Immigrants | Norway
99.9
/100
|
#53
Exceptional
$51,758
Immigrants | Indonesia
99.9
/100
|
#54
Exceptional
$51,715
Egyptians
99.9
/100
|
#55
Exceptional
$51,701
Immigrants | Pakistan
99.9
/100
|
#56
Exceptional
$51,693
Immigrants | Eastern Europe
99.9
/100
|
#57
Exceptional
$51,624
Immigrants | Bolivia
99.9
/100
|
#58
Exceptional
$51,605
Immigrants | Croatia
99.9
/100
|
#59
Exceptional
$51,581
Immigrants | Serbia
99.9
/100
|
#60
Exceptional
$51,557
Immigrants | Latvia
99.9
/100
|
#61
Exceptional
$51,555
Immigrants | Romania
99.9
/100
|
#62
Exceptional
$51,337
Immigrants | Bulgaria
99.9
/100
|
#63
Exceptional
$51,318
New Zealanders
99.9
/100
|
#64
Exceptional
$51,246
Greeks
99.9
/100
|
#65
Exceptional
$51,164
Afghans
99.9
/100
|
#66
Exceptional
$51,112