Alsatian vs Immigrants from Mexico Median Male Earnings
COMPARE
Alsatian
Immigrants from Mexico
Median Male Earnings
Median Male Earnings Comparison
Alsatians
Immigrants from Mexico
$55,380
MEDIAN MALE EARNINGS
70.5/ 100
METRIC RATING
159th/ 347
METRIC RANK
$44,960
MEDIAN MALE EARNINGS
0.0/ 100
METRIC RATING
330th/ 347
METRIC RANK
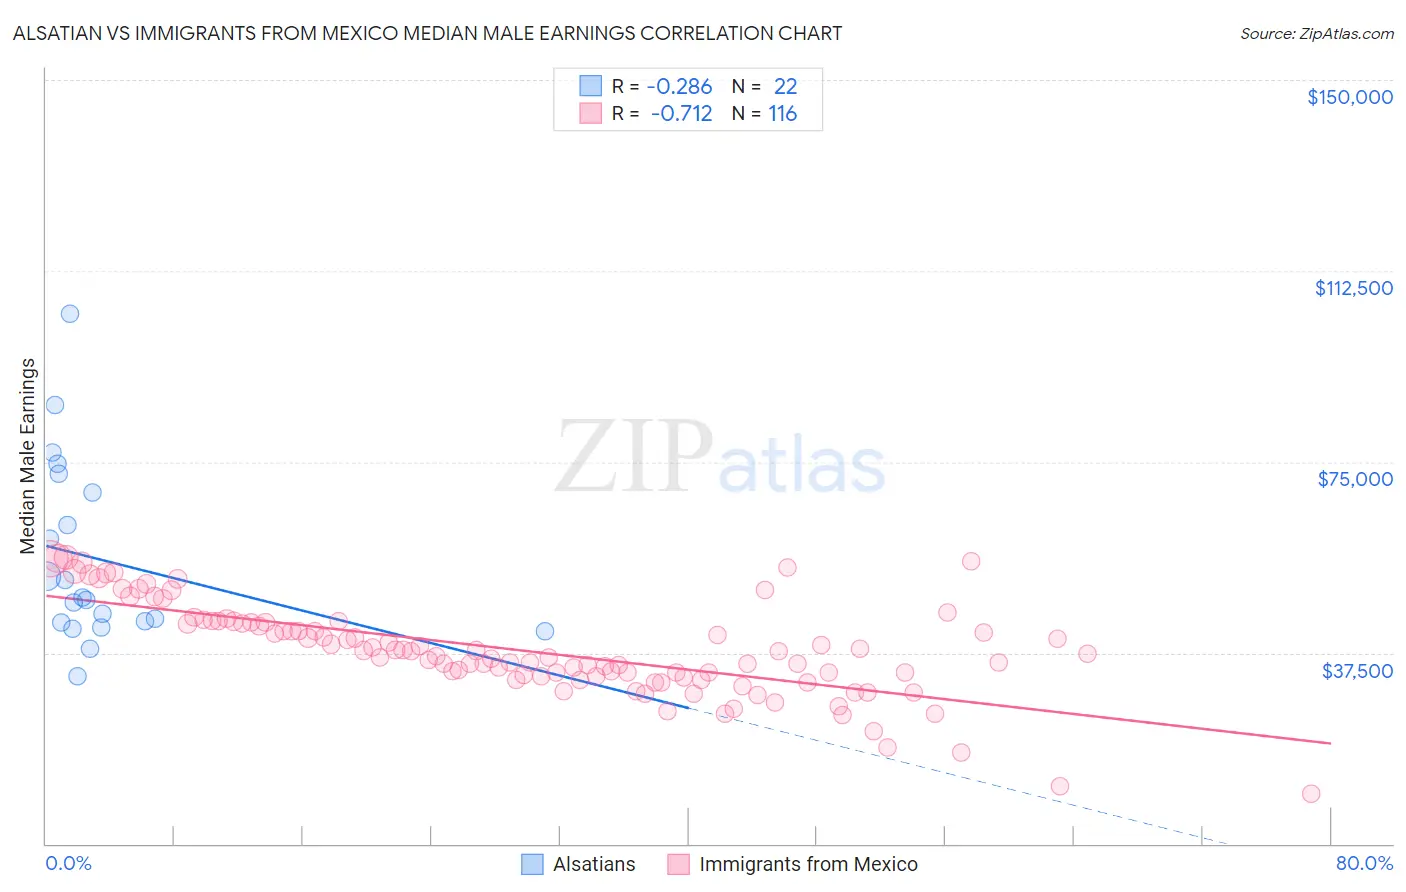
Alsatian vs Immigrants from Mexico Median Male Earnings Correlation Chart
The statistical analysis conducted on geographies consisting of 82,669,141 people shows a weak negative correlation between the proportion of Alsatians and median male earnings in the United States with a correlation coefficient (R) of -0.286 and weighted average of $55,380. Similarly, the statistical analysis conducted on geographies consisting of 513,109,400 people shows a strong negative correlation between the proportion of Immigrants from Mexico and median male earnings in the United States with a correlation coefficient (R) of -0.712 and weighted average of $44,960, a difference of 23.2%.
Median Male Earnings Correlation Summary
| Measurement | Alsatian | Immigrants from Mexico |
| Minimum | $33,005 | $9,917 |
| Maximum | $104,004 | $56,239 |
| Range | $70,999 | $46,322 |
| Mean | $55,815 | $37,983 |
| Median | $48,104 | $37,054 |
| Interquartile 25% (IQ1) | $43,478 | $32,850 |
| Interquartile 75% (IQ3) | $69,063 | $43,508 |
| Interquartile Range (IQR) | $25,585 | $10,658 |
| Standard Deviation (Sample) | $17,889 | $9,092 |
| Standard Deviation (Population) | $17,478 | $9,053 |
Similar Demographics by Median Male Earnings
Demographics Similar to Alsatians by Median Male Earnings
In terms of median male earnings, the demographic groups most similar to Alsatians are Czechoslovakian ($55,382, a difference of 0.0%), Basque ($55,370, a difference of 0.020%), Belgian ($55,361, a difference of 0.030%), French ($55,350, a difference of 0.050%), and Icelander ($55,415, a difference of 0.060%).
| Demographics | Rating | Rank | Median Male Earnings |
| Peruvians | 75.8 /100 | #152 | Good $55,659 |
| Immigrants | Nepal | 75.0 /100 | #153 | Good $55,615 |
| Taiwanese | 73.9 /100 | #154 | Good $55,556 |
| Scandinavians | 73.4 /100 | #155 | Good $55,527 |
| Immigrants | Ethiopia | 71.6 /100 | #156 | Good $55,434 |
| Icelanders | 71.2 /100 | #157 | Good $55,415 |
| Czechoslovakians | 70.5 /100 | #158 | Good $55,382 |
| Alsatians | 70.5 /100 | #159 | Good $55,380 |
| Basques | 70.3 /100 | #160 | Good $55,370 |
| Belgians | 70.1 /100 | #161 | Good $55,361 |
| French | 69.9 /100 | #162 | Good $55,350 |
| Ugandans | 68.6 /100 | #163 | Good $55,290 |
| Immigrants | South Eastern Asia | 67.6 /100 | #164 | Good $55,241 |
| Immigrants | Portugal | 66.3 /100 | #165 | Good $55,182 |
| Germans | 61.6 /100 | #166 | Good $54,974 |
Demographics Similar to Immigrants from Mexico by Median Male Earnings
In terms of median male earnings, the demographic groups most similar to Immigrants from Mexico are Yakama ($45,002, a difference of 0.090%), Kiowa ($45,094, a difference of 0.30%), Native/Alaskan ($44,775, a difference of 0.41%), Bahamian ($44,756, a difference of 0.46%), and Immigrants from Bahamas ($45,176, a difference of 0.48%).
| Demographics | Rating | Rank | Median Male Earnings |
| Immigrants | Central America | 0.0 /100 | #323 | Tragic $45,538 |
| Blacks/African Americans | 0.0 /100 | #324 | Tragic $45,523 |
| Yuman | 0.0 /100 | #325 | Tragic $45,446 |
| Immigrants | Haiti | 0.0 /100 | #326 | Tragic $45,266 |
| Immigrants | Bahamas | 0.0 /100 | #327 | Tragic $45,176 |
| Kiowa | 0.0 /100 | #328 | Tragic $45,094 |
| Yakama | 0.0 /100 | #329 | Tragic $45,002 |
| Immigrants | Mexico | 0.0 /100 | #330 | Tragic $44,960 |
| Natives/Alaskans | 0.0 /100 | #331 | Tragic $44,775 |
| Bahamians | 0.0 /100 | #332 | Tragic $44,756 |
| Immigrants | Congo | 0.0 /100 | #333 | Tragic $44,204 |
| Immigrants | Yemen | 0.0 /100 | #334 | Tragic $44,083 |
| Spanish American Indians | 0.0 /100 | #335 | Tragic $44,010 |
| Immigrants | Cuba | 0.0 /100 | #336 | Tragic $43,461 |
| Menominee | 0.0 /100 | #337 | Tragic $42,581 |