Swedish vs Immigrants from Mexico Vision Disability
COMPARE
Swedish
Immigrants from Mexico
Vision Disability
Vision Disability Comparison
Swedes
Immigrants from Mexico
2.1%
VISION DISABILITY
94.2/ 100
METRIC RATING
106th/ 347
METRIC RANK
2.5%
VISION DISABILITY
0.0/ 100
METRIC RATING
296th/ 347
METRIC RANK
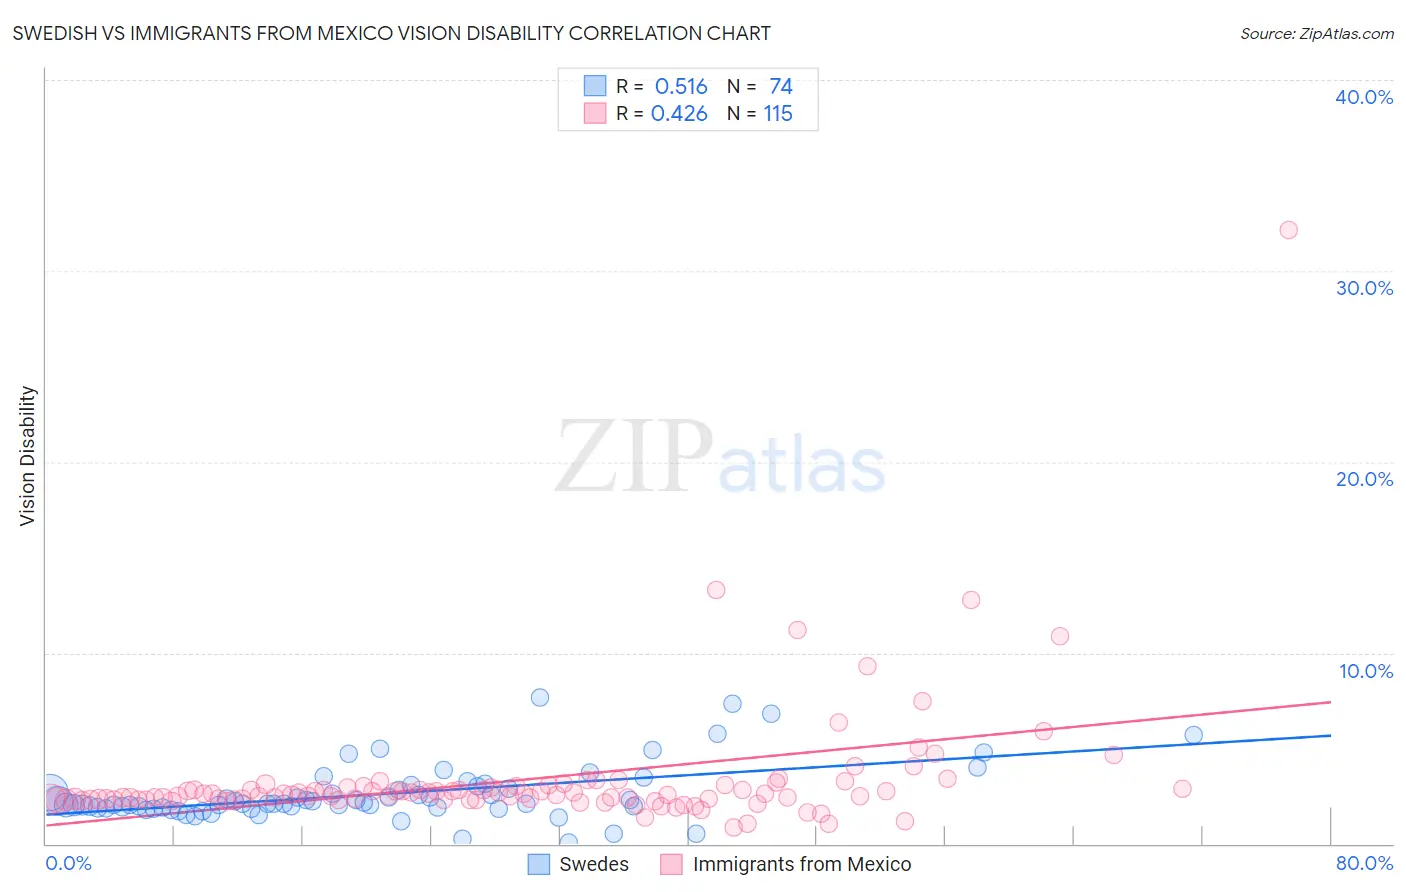
Swedish vs Immigrants from Mexico Vision Disability Correlation Chart
The statistical analysis conducted on geographies consisting of 537,778,731 people shows a substantial positive correlation between the proportion of Swedes and percentage of population with vision disability in the United States with a correlation coefficient (R) of 0.516 and weighted average of 2.1%. Similarly, the statistical analysis conducted on geographies consisting of 512,775,331 people shows a moderate positive correlation between the proportion of Immigrants from Mexico and percentage of population with vision disability in the United States with a correlation coefficient (R) of 0.426 and weighted average of 2.5%, a difference of 21.3%.
Vision Disability Correlation Summary
| Measurement | Swedish | Immigrants from Mexico |
| Minimum | 0.053% | 0.88% |
| Maximum | 7.7% | 32.1% |
| Range | 7.6% | 31.3% |
| Mean | 2.6% | 3.3% |
| Median | 2.1% | 2.6% |
| Interquartile 25% (IQ1) | 1.9% | 2.3% |
| Interquartile 75% (IQ3) | 2.9% | 3.0% |
| Interquartile Range (IQR) | 0.99% | 0.66% |
| Standard Deviation (Sample) | 1.5% | 3.4% |
| Standard Deviation (Population) | 1.4% | 3.4% |
Similar Demographics by Vision Disability
Demographics Similar to Swedes by Vision Disability
In terms of vision disability, the demographic groups most similar to Swedes are Danish (2.1%, a difference of 0.010%), Korean (2.1%, a difference of 0.030%), Carpatho Rusyn (2.1%, a difference of 0.040%), Chilean (2.1%, a difference of 0.050%), and Immigrants from Italy (2.1%, a difference of 0.060%).
| Demographics | Rating | Rank | Vision Disability |
| Estonians | 95.3 /100 | #99 | Exceptional 2.1% |
| Greeks | 95.1 /100 | #100 | Exceptional 2.1% |
| Albanians | 94.9 /100 | #101 | Exceptional 2.1% |
| Sri Lankans | 94.8 /100 | #102 | Exceptional 2.1% |
| Immigrants | Austria | 94.4 /100 | #103 | Exceptional 2.1% |
| Immigrants | Italy | 94.4 /100 | #104 | Exceptional 2.1% |
| Carpatho Rusyns | 94.3 /100 | #105 | Exceptional 2.1% |
| Swedes | 94.2 /100 | #106 | Exceptional 2.1% |
| Danes | 94.2 /100 | #107 | Exceptional 2.1% |
| Koreans | 94.1 /100 | #108 | Exceptional 2.1% |
| Chileans | 94.0 /100 | #109 | Exceptional 2.1% |
| Immigrants | Armenia | 93.8 /100 | #110 | Exceptional 2.1% |
| Peruvians | 93.5 /100 | #111 | Exceptional 2.1% |
| Immigrants | Denmark | 92.9 /100 | #112 | Exceptional 2.1% |
| Kenyans | 92.5 /100 | #113 | Exceptional 2.1% |
Demographics Similar to Immigrants from Mexico by Vision Disability
In terms of vision disability, the demographic groups most similar to Immigrants from Mexico are Delaware (2.5%, a difference of 0.11%), Ottawa (2.5%, a difference of 0.32%), Yaqui (2.5%, a difference of 0.66%), Crow (2.5%, a difference of 0.68%), and Immigrants from Dominica (2.5%, a difference of 0.68%).
| Demographics | Rating | Rank | Vision Disability |
| Immigrants | Nonimmigrants | 0.0 /100 | #289 | Tragic 2.5% |
| Immigrants | Cuba | 0.0 /100 | #290 | Tragic 2.5% |
| Immigrants | Honduras | 0.0 /100 | #291 | Tragic 2.5% |
| Crow | 0.0 /100 | #292 | Tragic 2.5% |
| Yaqui | 0.0 /100 | #293 | Tragic 2.5% |
| Ottawa | 0.0 /100 | #294 | Tragic 2.5% |
| Delaware | 0.0 /100 | #295 | Tragic 2.5% |
| Immigrants | Mexico | 0.0 /100 | #296 | Tragic 2.5% |
| Immigrants | Dominica | 0.0 /100 | #297 | Tragic 2.5% |
| Mexicans | 0.0 /100 | #298 | Tragic 2.5% |
| Cree | 0.0 /100 | #299 | Tragic 2.5% |
| Africans | 0.0 /100 | #300 | Tragic 2.5% |
| Menominee | 0.0 /100 | #301 | Tragic 2.5% |
| Spanish American Indians | 0.0 /100 | #302 | Tragic 2.6% |
| Immigrants | Cabo Verde | 0.0 /100 | #303 | Tragic 2.6% |