Sudanese vs Spaniard Median Family Income
COMPARE
Sudanese
Spaniard
Median Family Income
Median Family Income Comparison
Sudanese
Spaniards
$96,783
MEDIAN FAMILY INCOME
4.7/ 100
METRIC RATING
220th/ 347
METRIC RANK
$101,617
MEDIAN FAMILY INCOME
36.8/ 100
METRIC RATING
181st/ 347
METRIC RANK
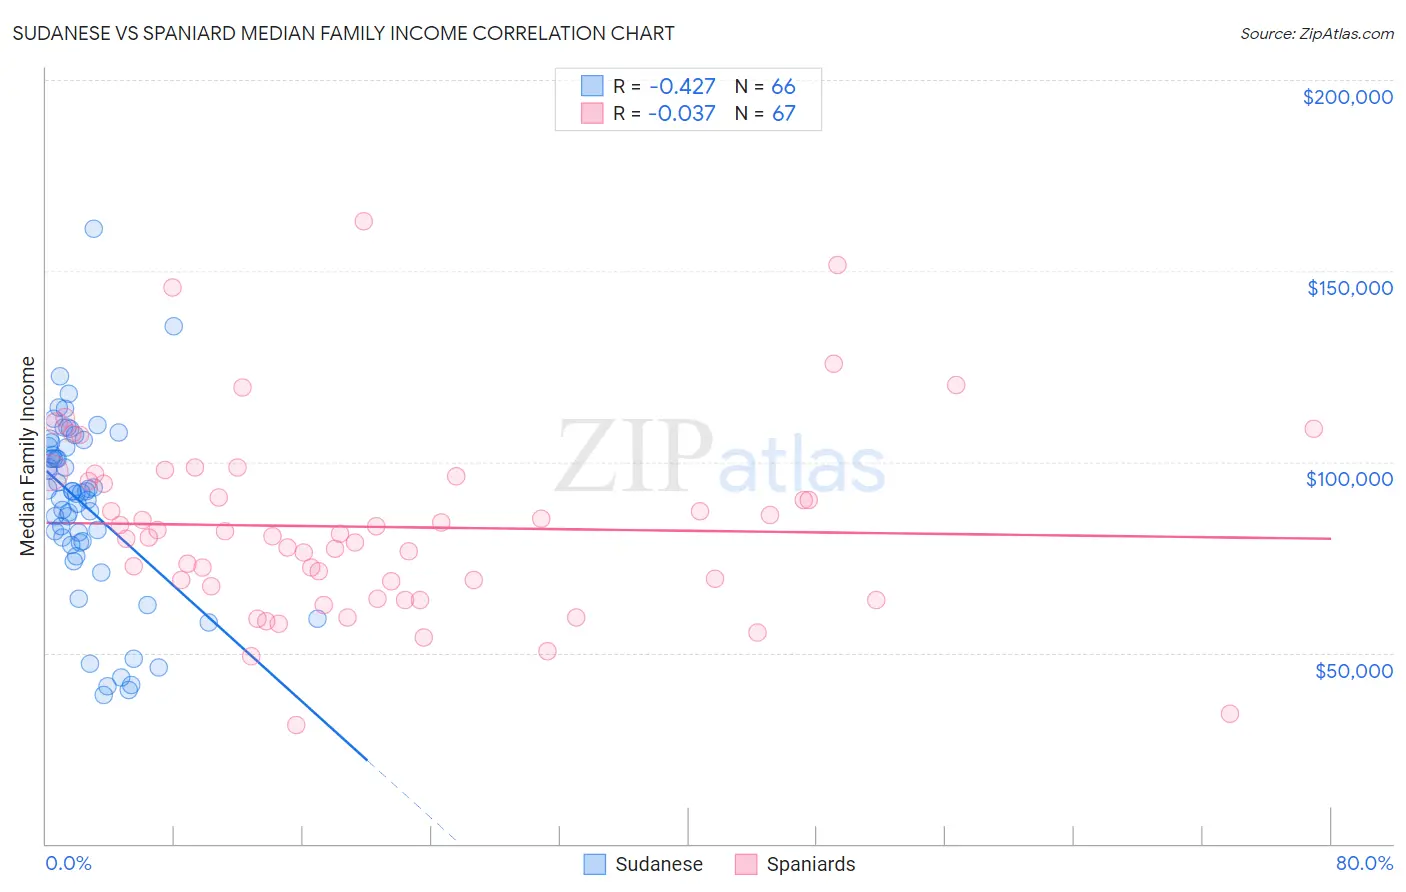
Sudanese vs Spaniard Median Family Income Correlation Chart
The statistical analysis conducted on geographies consisting of 110,081,716 people shows a moderate negative correlation between the proportion of Sudanese and median family income in the United States with a correlation coefficient (R) of -0.427 and weighted average of $96,783. Similarly, the statistical analysis conducted on geographies consisting of 442,935,901 people shows no correlation between the proportion of Spaniards and median family income in the United States with a correlation coefficient (R) of -0.037 and weighted average of $101,617, a difference of 5.0%.
Median Family Income Correlation Summary
| Measurement | Sudanese | Spaniard |
| Minimum | $38,840 | $31,232 |
| Maximum | $160,922 | $162,957 |
| Range | $122,082 | $131,725 |
| Mean | $88,541 | $82,984 |
| Median | $92,056 | $80,417 |
| Interquartile 25% (IQ1) | $78,776 | $67,468 |
| Interquartile 75% (IQ3) | $104,200 | $96,250 |
| Interquartile Range (IQR) | $25,424 | $28,782 |
| Standard Deviation (Sample) | $23,841 | $24,669 |
| Standard Deviation (Population) | $23,660 | $24,485 |
Similar Demographics by Median Family Income
Demographics Similar to Sudanese by Median Family Income
In terms of median family income, the demographic groups most similar to Sudanese are Delaware ($96,958, a difference of 0.18%), Immigrants from Ghana ($96,544, a difference of 0.25%), Immigrants from Nigeria ($96,439, a difference of 0.36%), Immigrants from Cambodia ($97,222, a difference of 0.45%), and Japanese ($97,288, a difference of 0.52%).
| Demographics | Rating | Rank | Median Family Income |
| Immigrants | Armenia | 7.0 /100 | #213 | Tragic $97,605 |
| Bermudans | 6.9 /100 | #214 | Tragic $97,577 |
| Nigerians | 6.7 /100 | #215 | Tragic $97,522 |
| Immigrants | Bosnia and Herzegovina | 6.4 /100 | #216 | Tragic $97,432 |
| Japanese | 6.0 /100 | #217 | Tragic $97,288 |
| Immigrants | Cambodia | 5.8 /100 | #218 | Tragic $97,222 |
| Delaware | 5.1 /100 | #219 | Tragic $96,958 |
| Sudanese | 4.7 /100 | #220 | Tragic $96,783 |
| Immigrants | Ghana | 4.2 /100 | #221 | Tragic $96,544 |
| Immigrants | Nigeria | 4.0 /100 | #222 | Tragic $96,439 |
| Venezuelans | 3.7 /100 | #223 | Tragic $96,281 |
| Immigrants | Nonimmigrants | 3.6 /100 | #224 | Tragic $96,231 |
| Vietnamese | 3.4 /100 | #225 | Tragic $96,123 |
| Immigrants | Panama | 2.7 /100 | #226 | Tragic $95,647 |
| Alaska Natives | 2.6 /100 | #227 | Tragic $95,573 |
Demographics Similar to Spaniards by Median Family Income
In terms of median family income, the demographic groups most similar to Spaniards are French Canadian ($101,634, a difference of 0.020%), Tsimshian ($101,543, a difference of 0.070%), Kenyan ($101,417, a difference of 0.20%), South American ($101,856, a difference of 0.23%), and Immigrants from Costa Rica ($101,354, a difference of 0.26%).
| Demographics | Rating | Rank | Median Family Income |
| Finns | 50.0 /100 | #174 | Average $102,676 |
| Immigrants | Eastern Africa | 47.1 /100 | #175 | Average $102,451 |
| French | 46.1 /100 | #176 | Average $102,368 |
| Germans | 44.6 /100 | #177 | Average $102,254 |
| Welsh | 43.3 /100 | #178 | Average $102,151 |
| South Americans | 39.7 /100 | #179 | Fair $101,856 |
| French Canadians | 37.0 /100 | #180 | Fair $101,634 |
| Spaniards | 36.8 /100 | #181 | Fair $101,617 |
| Tsimshian | 35.9 /100 | #182 | Fair $101,543 |
| Kenyans | 34.5 /100 | #183 | Fair $101,417 |
| Immigrants | Costa Rica | 33.7 /100 | #184 | Fair $101,354 |
| Dutch | 31.9 /100 | #185 | Fair $101,192 |
| Celtics | 31.3 /100 | #186 | Fair $101,139 |
| Tlingit-Haida | 30.8 /100 | #187 | Fair $101,092 |
| Guamanians/Chamorros | 30.5 /100 | #188 | Fair $101,061 |