Comanche vs Spaniard Median Family Income
COMPARE
Comanche
Spaniard
Median Family Income
Median Family Income Comparison
Comanche
Spaniards
$88,556
MEDIAN FAMILY INCOME
0.1/ 100
METRIC RATING
282nd/ 347
METRIC RANK
$101,617
MEDIAN FAMILY INCOME
36.8/ 100
METRIC RATING
181st/ 347
METRIC RANK
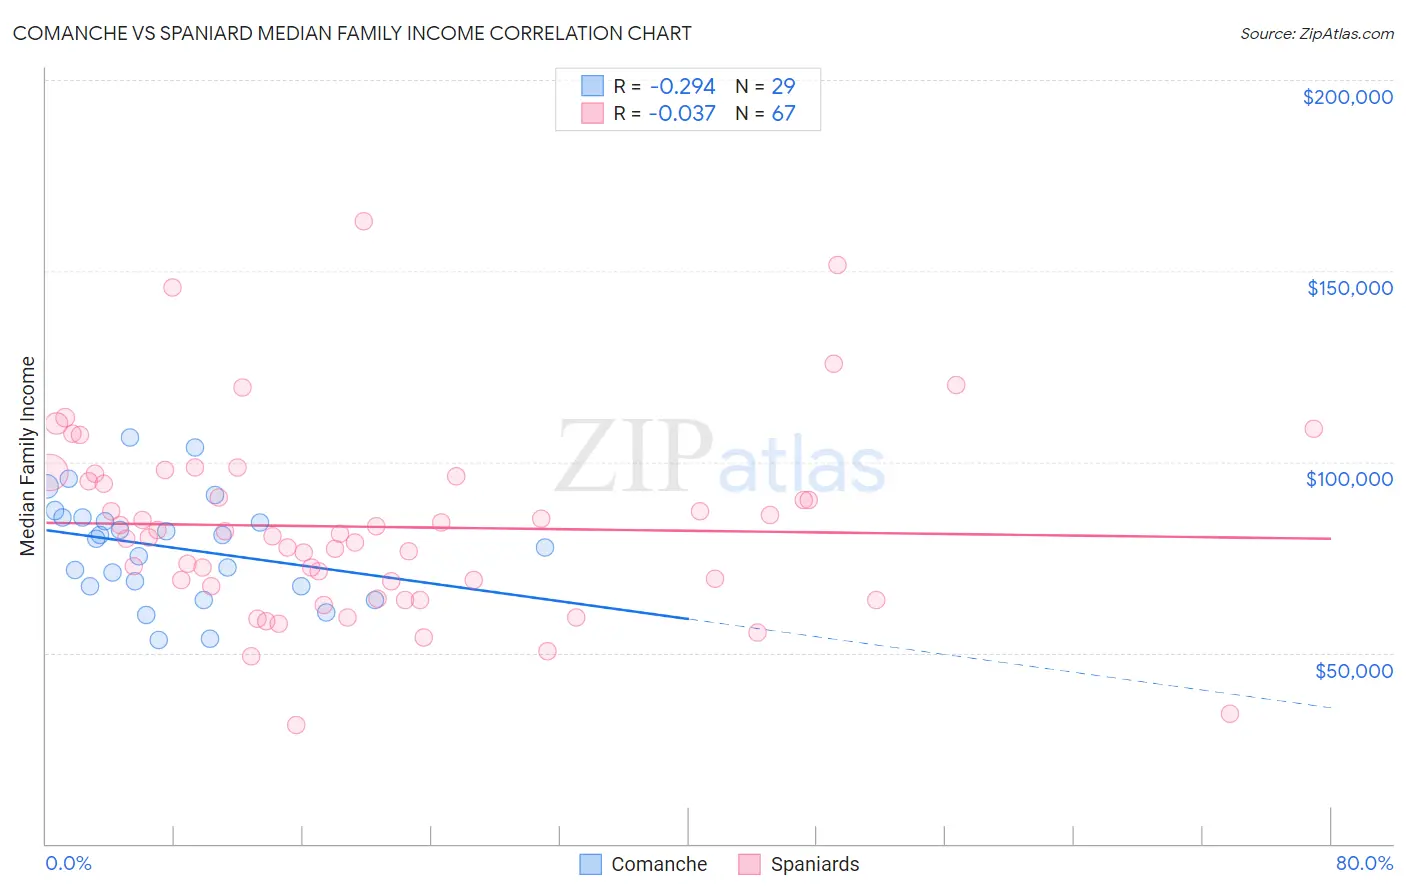
Comanche vs Spaniard Median Family Income Correlation Chart
The statistical analysis conducted on geographies consisting of 109,751,078 people shows a weak negative correlation between the proportion of Comanche and median family income in the United States with a correlation coefficient (R) of -0.294 and weighted average of $88,556. Similarly, the statistical analysis conducted on geographies consisting of 442,935,901 people shows no correlation between the proportion of Spaniards and median family income in the United States with a correlation coefficient (R) of -0.037 and weighted average of $101,617, a difference of 14.7%.
Median Family Income Correlation Summary
| Measurement | Comanche | Spaniard |
| Minimum | $53,472 | $31,232 |
| Maximum | $106,375 | $162,957 |
| Range | $52,903 | $131,725 |
| Mean | $77,578 | $82,984 |
| Median | $79,900 | $80,417 |
| Interquartile 25% (IQ1) | $67,370 | $67,468 |
| Interquartile 75% (IQ3) | $85,455 | $96,250 |
| Interquartile Range (IQR) | $18,086 | $28,782 |
| Standard Deviation (Sample) | $13,620 | $24,669 |
| Standard Deviation (Population) | $13,383 | $24,485 |
Similar Demographics by Median Family Income
Demographics Similar to Comanche by Median Family Income
In terms of median family income, the demographic groups most similar to Comanche are Blackfeet ($88,717, a difference of 0.18%), Bangladeshi ($88,358, a difference of 0.22%), Indonesian ($88,301, a difference of 0.29%), Guatemalan ($88,295, a difference of 0.29%), and Immigrants from Nicaragua ($88,267, a difference of 0.33%).
| Demographics | Rating | Rank | Median Family Income |
| Immigrants | St. Vincent and the Grenadines | 0.2 /100 | #275 | Tragic $90,094 |
| Immigrants | Zaire | 0.1 /100 | #276 | Tragic $89,285 |
| Immigrants | Jamaica | 0.1 /100 | #277 | Tragic $89,268 |
| Immigrants | Grenada | 0.1 /100 | #278 | Tragic $89,249 |
| Immigrants | Belize | 0.1 /100 | #279 | Tragic $89,197 |
| British West Indians | 0.1 /100 | #280 | Tragic $88,987 |
| Blackfeet | 0.1 /100 | #281 | Tragic $88,717 |
| Comanche | 0.1 /100 | #282 | Tragic $88,556 |
| Bangladeshis | 0.1 /100 | #283 | Tragic $88,358 |
| Indonesians | 0.1 /100 | #284 | Tragic $88,301 |
| Guatemalans | 0.1 /100 | #285 | Tragic $88,295 |
| Immigrants | Nicaragua | 0.1 /100 | #286 | Tragic $88,267 |
| Potawatomi | 0.1 /100 | #287 | Tragic $88,265 |
| Cherokee | 0.1 /100 | #288 | Tragic $88,209 |
| Central American Indians | 0.1 /100 | #289 | Tragic $88,034 |
Demographics Similar to Spaniards by Median Family Income
In terms of median family income, the demographic groups most similar to Spaniards are French Canadian ($101,634, a difference of 0.020%), Tsimshian ($101,543, a difference of 0.070%), Kenyan ($101,417, a difference of 0.20%), South American ($101,856, a difference of 0.23%), and Immigrants from Costa Rica ($101,354, a difference of 0.26%).
| Demographics | Rating | Rank | Median Family Income |
| Finns | 50.0 /100 | #174 | Average $102,676 |
| Immigrants | Eastern Africa | 47.1 /100 | #175 | Average $102,451 |
| French | 46.1 /100 | #176 | Average $102,368 |
| Germans | 44.6 /100 | #177 | Average $102,254 |
| Welsh | 43.3 /100 | #178 | Average $102,151 |
| South Americans | 39.7 /100 | #179 | Fair $101,856 |
| French Canadians | 37.0 /100 | #180 | Fair $101,634 |
| Spaniards | 36.8 /100 | #181 | Fair $101,617 |
| Tsimshian | 35.9 /100 | #182 | Fair $101,543 |
| Kenyans | 34.5 /100 | #183 | Fair $101,417 |
| Immigrants | Costa Rica | 33.7 /100 | #184 | Fair $101,354 |
| Dutch | 31.9 /100 | #185 | Fair $101,192 |
| Celtics | 31.3 /100 | #186 | Fair $101,139 |
| Tlingit-Haida | 30.8 /100 | #187 | Fair $101,092 |
| Guamanians/Chamorros | 30.5 /100 | #188 | Fair $101,061 |