Sudanese vs Comanche Median Family Income
COMPARE
Sudanese
Comanche
Median Family Income
Median Family Income Comparison
Sudanese
Comanche
$96,783
MEDIAN FAMILY INCOME
4.7/ 100
METRIC RATING
220th/ 347
METRIC RANK
$88,556
MEDIAN FAMILY INCOME
0.1/ 100
METRIC RATING
282nd/ 347
METRIC RANK
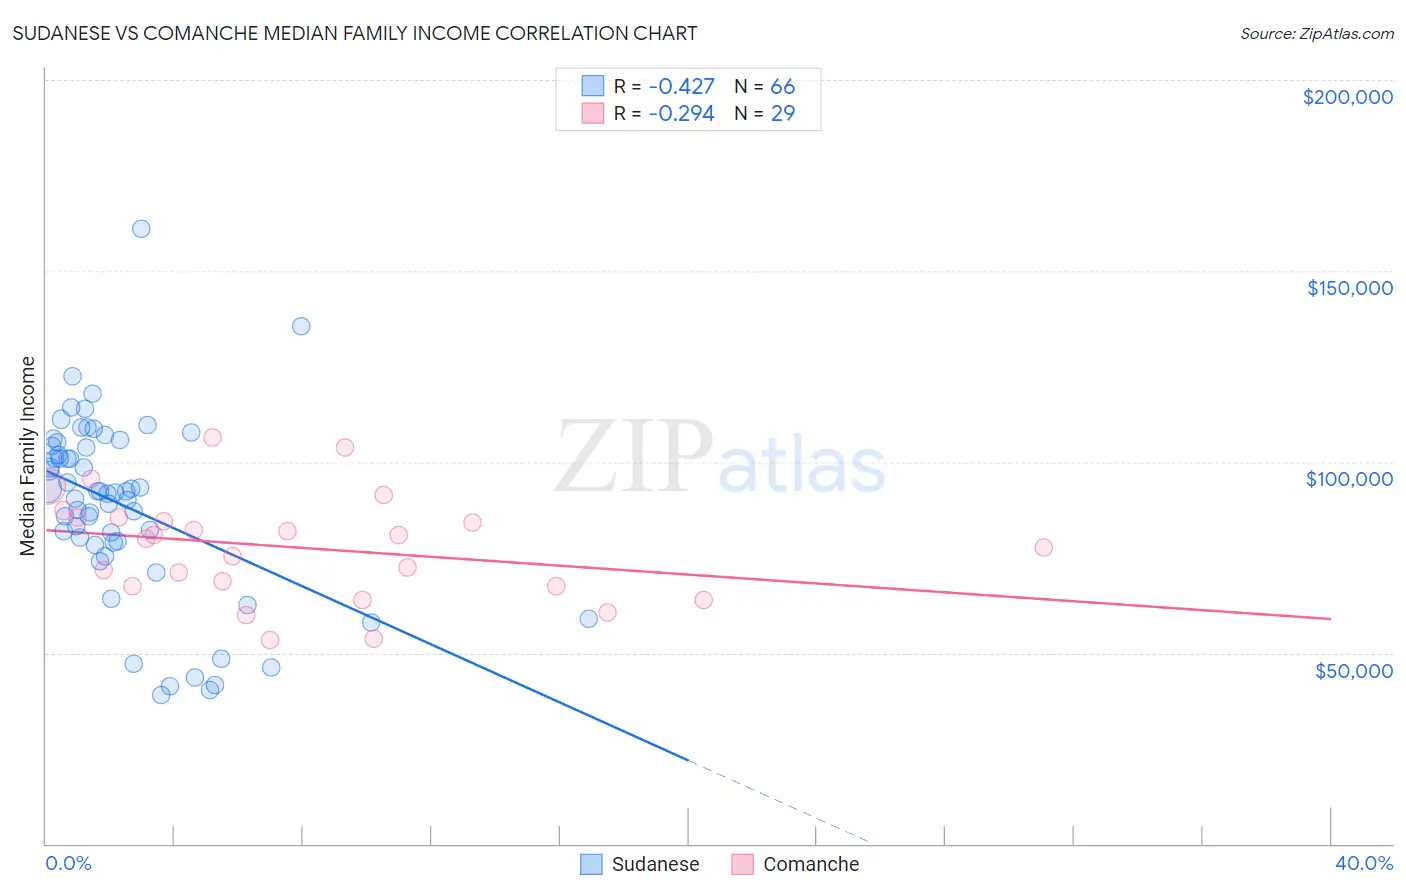
Sudanese vs Comanche Median Family Income Correlation Chart
The statistical analysis conducted on geographies consisting of 110,081,716 people shows a moderate negative correlation between the proportion of Sudanese and median family income in the United States with a correlation coefficient (R) of -0.427 and weighted average of $96,783. Similarly, the statistical analysis conducted on geographies consisting of 109,751,078 people shows a weak negative correlation between the proportion of Comanche and median family income in the United States with a correlation coefficient (R) of -0.294 and weighted average of $88,556, a difference of 9.3%.
Median Family Income Correlation Summary
| Measurement | Sudanese | Comanche |
| Minimum | $38,840 | $53,472 |
| Maximum | $160,922 | $106,375 |
| Range | $122,082 | $52,903 |
| Mean | $88,541 | $77,578 |
| Median | $92,056 | $79,900 |
| Interquartile 25% (IQ1) | $78,776 | $67,370 |
| Interquartile 75% (IQ3) | $104,200 | $85,455 |
| Interquartile Range (IQR) | $25,424 | $18,086 |
| Standard Deviation (Sample) | $23,841 | $13,620 |
| Standard Deviation (Population) | $23,660 | $13,383 |
Similar Demographics by Median Family Income
Demographics Similar to Sudanese by Median Family Income
In terms of median family income, the demographic groups most similar to Sudanese are Delaware ($96,958, a difference of 0.18%), Immigrants from Ghana ($96,544, a difference of 0.25%), Immigrants from Nigeria ($96,439, a difference of 0.36%), Immigrants from Cambodia ($97,222, a difference of 0.45%), and Japanese ($97,288, a difference of 0.52%).
| Demographics | Rating | Rank | Median Family Income |
| Immigrants | Armenia | 7.0 /100 | #213 | Tragic $97,605 |
| Bermudans | 6.9 /100 | #214 | Tragic $97,577 |
| Nigerians | 6.7 /100 | #215 | Tragic $97,522 |
| Immigrants | Bosnia and Herzegovina | 6.4 /100 | #216 | Tragic $97,432 |
| Japanese | 6.0 /100 | #217 | Tragic $97,288 |
| Immigrants | Cambodia | 5.8 /100 | #218 | Tragic $97,222 |
| Delaware | 5.1 /100 | #219 | Tragic $96,958 |
| Sudanese | 4.7 /100 | #220 | Tragic $96,783 |
| Immigrants | Ghana | 4.2 /100 | #221 | Tragic $96,544 |
| Immigrants | Nigeria | 4.0 /100 | #222 | Tragic $96,439 |
| Venezuelans | 3.7 /100 | #223 | Tragic $96,281 |
| Immigrants | Nonimmigrants | 3.6 /100 | #224 | Tragic $96,231 |
| Vietnamese | 3.4 /100 | #225 | Tragic $96,123 |
| Immigrants | Panama | 2.7 /100 | #226 | Tragic $95,647 |
| Alaska Natives | 2.6 /100 | #227 | Tragic $95,573 |
Demographics Similar to Comanche by Median Family Income
In terms of median family income, the demographic groups most similar to Comanche are Blackfeet ($88,717, a difference of 0.18%), Bangladeshi ($88,358, a difference of 0.22%), Indonesian ($88,301, a difference of 0.29%), Guatemalan ($88,295, a difference of 0.29%), and Immigrants from Nicaragua ($88,267, a difference of 0.33%).
| Demographics | Rating | Rank | Median Family Income |
| Immigrants | St. Vincent and the Grenadines | 0.2 /100 | #275 | Tragic $90,094 |
| Immigrants | Zaire | 0.1 /100 | #276 | Tragic $89,285 |
| Immigrants | Jamaica | 0.1 /100 | #277 | Tragic $89,268 |
| Immigrants | Grenada | 0.1 /100 | #278 | Tragic $89,249 |
| Immigrants | Belize | 0.1 /100 | #279 | Tragic $89,197 |
| British West Indians | 0.1 /100 | #280 | Tragic $88,987 |
| Blackfeet | 0.1 /100 | #281 | Tragic $88,717 |
| Comanche | 0.1 /100 | #282 | Tragic $88,556 |
| Bangladeshis | 0.1 /100 | #283 | Tragic $88,358 |
| Indonesians | 0.1 /100 | #284 | Tragic $88,301 |
| Guatemalans | 0.1 /100 | #285 | Tragic $88,295 |
| Immigrants | Nicaragua | 0.1 /100 | #286 | Tragic $88,267 |
| Potawatomi | 0.1 /100 | #287 | Tragic $88,265 |
| Cherokee | 0.1 /100 | #288 | Tragic $88,209 |
| Central American Indians | 0.1 /100 | #289 | Tragic $88,034 |