Sudanese vs Tohono O'odham Median Family Income
COMPARE
Sudanese
Tohono O'odham
Median Family Income
Median Family Income Comparison
Sudanese
Tohono O'odham
$96,783
MEDIAN FAMILY INCOME
4.7/ 100
METRIC RATING
220th/ 347
METRIC RANK
$72,193
MEDIAN FAMILY INCOME
0.0/ 100
METRIC RATING
344th/ 347
METRIC RANK
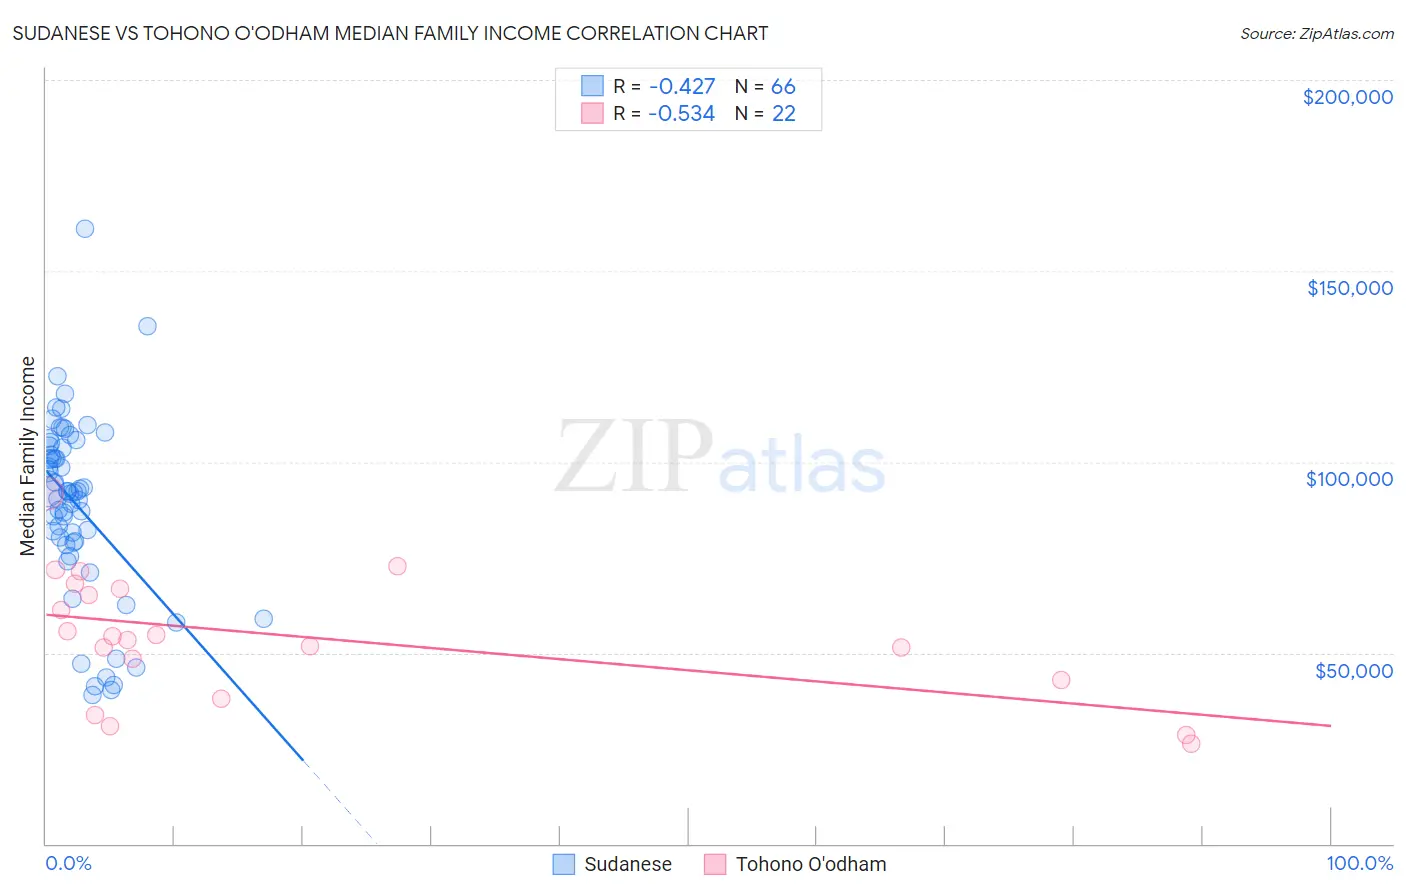
Sudanese vs Tohono O'odham Median Family Income Correlation Chart
The statistical analysis conducted on geographies consisting of 110,081,716 people shows a moderate negative correlation between the proportion of Sudanese and median family income in the United States with a correlation coefficient (R) of -0.427 and weighted average of $96,783. Similarly, the statistical analysis conducted on geographies consisting of 58,714,192 people shows a substantial negative correlation between the proportion of Tohono O'odham and median family income in the United States with a correlation coefficient (R) of -0.534 and weighted average of $72,193, a difference of 34.1%.
Median Family Income Correlation Summary
| Measurement | Sudanese | Tohono O'odham |
| Minimum | $38,840 | $26,100 |
| Maximum | $160,922 | $91,728 |
| Range | $122,082 | $65,628 |
| Mean | $88,541 | $54,111 |
| Median | $92,056 | $53,986 |
| Interquartile 25% (IQ1) | $78,776 | $43,011 |
| Interquartile 75% (IQ3) | $104,200 | $66,792 |
| Interquartile Range (IQR) | $25,424 | $23,781 |
| Standard Deviation (Sample) | $23,841 | $16,520 |
| Standard Deviation (Population) | $23,660 | $16,140 |
Similar Demographics by Median Family Income
Demographics Similar to Sudanese by Median Family Income
In terms of median family income, the demographic groups most similar to Sudanese are Delaware ($96,958, a difference of 0.18%), Immigrants from Ghana ($96,544, a difference of 0.25%), Immigrants from Nigeria ($96,439, a difference of 0.36%), Immigrants from Cambodia ($97,222, a difference of 0.45%), and Japanese ($97,288, a difference of 0.52%).
| Demographics | Rating | Rank | Median Family Income |
| Immigrants | Armenia | 7.0 /100 | #213 | Tragic $97,605 |
| Bermudans | 6.9 /100 | #214 | Tragic $97,577 |
| Nigerians | 6.7 /100 | #215 | Tragic $97,522 |
| Immigrants | Bosnia and Herzegovina | 6.4 /100 | #216 | Tragic $97,432 |
| Japanese | 6.0 /100 | #217 | Tragic $97,288 |
| Immigrants | Cambodia | 5.8 /100 | #218 | Tragic $97,222 |
| Delaware | 5.1 /100 | #219 | Tragic $96,958 |
| Sudanese | 4.7 /100 | #220 | Tragic $96,783 |
| Immigrants | Ghana | 4.2 /100 | #221 | Tragic $96,544 |
| Immigrants | Nigeria | 4.0 /100 | #222 | Tragic $96,439 |
| Venezuelans | 3.7 /100 | #223 | Tragic $96,281 |
| Immigrants | Nonimmigrants | 3.6 /100 | #224 | Tragic $96,231 |
| Vietnamese | 3.4 /100 | #225 | Tragic $96,123 |
| Immigrants | Panama | 2.7 /100 | #226 | Tragic $95,647 |
| Alaska Natives | 2.6 /100 | #227 | Tragic $95,573 |
Demographics Similar to Tohono O'odham by Median Family Income
In terms of median family income, the demographic groups most similar to Tohono O'odham are Navajo ($70,989, a difference of 1.7%), Puerto Rican ($70,423, a difference of 2.5%), Lumbee ($68,679, a difference of 5.1%), Houma ($76,188, a difference of 5.5%), and Crow ($76,605, a difference of 6.1%).
| Demographics | Rating | Rank | Median Family Income |
| Kiowa | 0.0 /100 | #333 | Tragic $80,885 |
| Menominee | 0.0 /100 | #334 | Tragic $79,563 |
| Yup'ik | 0.0 /100 | #335 | Tragic $79,290 |
| Immigrants | Cuba | 0.0 /100 | #336 | Tragic $78,249 |
| Yuman | 0.0 /100 | #337 | Tragic $78,055 |
| Immigrants | Yemen | 0.0 /100 | #338 | Tragic $77,457 |
| Pima | 0.0 /100 | #339 | Tragic $77,431 |
| Hopi | 0.0 /100 | #340 | Tragic $77,188 |
| Pueblo | 0.0 /100 | #341 | Tragic $76,880 |
| Crow | 0.0 /100 | #342 | Tragic $76,605 |
| Houma | 0.0 /100 | #343 | Tragic $76,188 |
| Tohono O'odham | 0.0 /100 | #344 | Tragic $72,193 |
| Navajo | 0.0 /100 | #345 | Tragic $70,989 |
| Puerto Ricans | 0.0 /100 | #346 | Tragic $70,423 |
| Lumbee | 0.0 /100 | #347 | Tragic $68,679 |