U.S. Virgin Islander vs Spaniard Median Family Income
COMPARE
U.S. Virgin Islander
Spaniard
Median Family Income
Median Family Income Comparison
U.S. Virgin Islanders
Spaniards
$85,294
MEDIAN FAMILY INCOME
0.0/ 100
METRIC RATING
308th/ 347
METRIC RANK
$101,617
MEDIAN FAMILY INCOME
36.8/ 100
METRIC RATING
181st/ 347
METRIC RANK
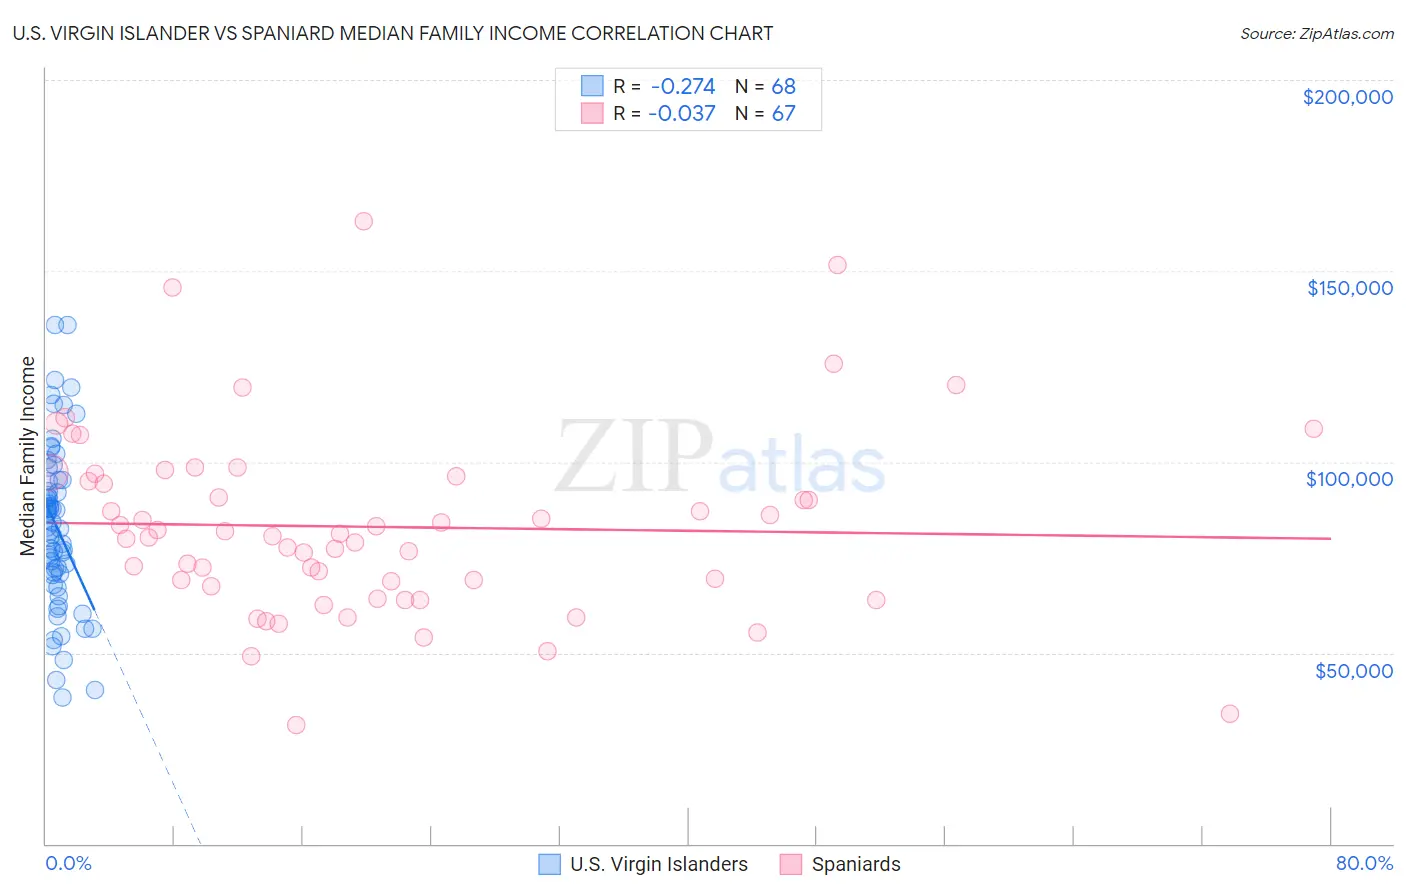
U.S. Virgin Islander vs Spaniard Median Family Income Correlation Chart
The statistical analysis conducted on geographies consisting of 87,505,006 people shows a weak negative correlation between the proportion of U.S. Virgin Islanders and median family income in the United States with a correlation coefficient (R) of -0.274 and weighted average of $85,294. Similarly, the statistical analysis conducted on geographies consisting of 442,935,901 people shows no correlation between the proportion of Spaniards and median family income in the United States with a correlation coefficient (R) of -0.037 and weighted average of $101,617, a difference of 19.1%.
Median Family Income Correlation Summary
| Measurement | U.S. Virgin Islander | Spaniard |
| Minimum | $38,346 | $31,232 |
| Maximum | $136,000 | $162,957 |
| Range | $97,654 | $131,725 |
| Mean | $82,878 | $82,984 |
| Median | $82,757 | $80,417 |
| Interquartile 25% (IQ1) | $70,515 | $67,468 |
| Interquartile 75% (IQ3) | $95,033 | $96,250 |
| Interquartile Range (IQR) | $24,518 | $28,782 |
| Standard Deviation (Sample) | $21,454 | $24,669 |
| Standard Deviation (Population) | $21,296 | $24,485 |
Similar Demographics by Median Family Income
Demographics Similar to U.S. Virgin Islanders by Median Family Income
In terms of median family income, the demographic groups most similar to U.S. Virgin Islanders are Chickasaw ($85,356, a difference of 0.070%), Haitian ($85,218, a difference of 0.090%), Paiute ($85,414, a difference of 0.14%), Immigrants from Dominica ($85,411, a difference of 0.14%), and Immigrants from Central America ($85,050, a difference of 0.29%).
| Demographics | Rating | Rank | Median Family Income |
| Colville | 0.0 /100 | #301 | Tragic $85,792 |
| Spanish American Indians | 0.0 /100 | #302 | Tragic $85,728 |
| Hispanics or Latinos | 0.0 /100 | #303 | Tragic $85,647 |
| Mexicans | 0.0 /100 | #304 | Tragic $85,618 |
| Paiute | 0.0 /100 | #305 | Tragic $85,414 |
| Immigrants | Dominica | 0.0 /100 | #306 | Tragic $85,411 |
| Chickasaw | 0.0 /100 | #307 | Tragic $85,356 |
| U.S. Virgin Islanders | 0.0 /100 | #308 | Tragic $85,294 |
| Haitians | 0.0 /100 | #309 | Tragic $85,218 |
| Immigrants | Central America | 0.0 /100 | #310 | Tragic $85,050 |
| Hondurans | 0.0 /100 | #311 | Tragic $85,004 |
| Cubans | 0.0 /100 | #312 | Tragic $84,981 |
| Choctaw | 0.0 /100 | #313 | Tragic $84,835 |
| Immigrants | Bahamas | 0.0 /100 | #314 | Tragic $84,732 |
| Apache | 0.0 /100 | #315 | Tragic $84,451 |
Demographics Similar to Spaniards by Median Family Income
In terms of median family income, the demographic groups most similar to Spaniards are French Canadian ($101,634, a difference of 0.020%), Tsimshian ($101,543, a difference of 0.070%), Kenyan ($101,417, a difference of 0.20%), South American ($101,856, a difference of 0.23%), and Immigrants from Costa Rica ($101,354, a difference of 0.26%).
| Demographics | Rating | Rank | Median Family Income |
| Finns | 50.0 /100 | #174 | Average $102,676 |
| Immigrants | Eastern Africa | 47.1 /100 | #175 | Average $102,451 |
| French | 46.1 /100 | #176 | Average $102,368 |
| Germans | 44.6 /100 | #177 | Average $102,254 |
| Welsh | 43.3 /100 | #178 | Average $102,151 |
| South Americans | 39.7 /100 | #179 | Fair $101,856 |
| French Canadians | 37.0 /100 | #180 | Fair $101,634 |
| Spaniards | 36.8 /100 | #181 | Fair $101,617 |
| Tsimshian | 35.9 /100 | #182 | Fair $101,543 |
| Kenyans | 34.5 /100 | #183 | Fair $101,417 |
| Immigrants | Costa Rica | 33.7 /100 | #184 | Fair $101,354 |
| Dutch | 31.9 /100 | #185 | Fair $101,192 |
| Celtics | 31.3 /100 | #186 | Fair $101,139 |
| Tlingit-Haida | 30.8 /100 | #187 | Fair $101,092 |
| Guamanians/Chamorros | 30.5 /100 | #188 | Fair $101,061 |