Egyptian vs Spaniard Median Family Income
COMPARE
Egyptian
Spaniard
Median Family Income
Median Family Income Comparison
Egyptians
Spaniards
$114,119
MEDIAN FAMILY INCOME
99.7/ 100
METRIC RATING
65th/ 347
METRIC RANK
$101,617
MEDIAN FAMILY INCOME
36.8/ 100
METRIC RATING
181st/ 347
METRIC RANK
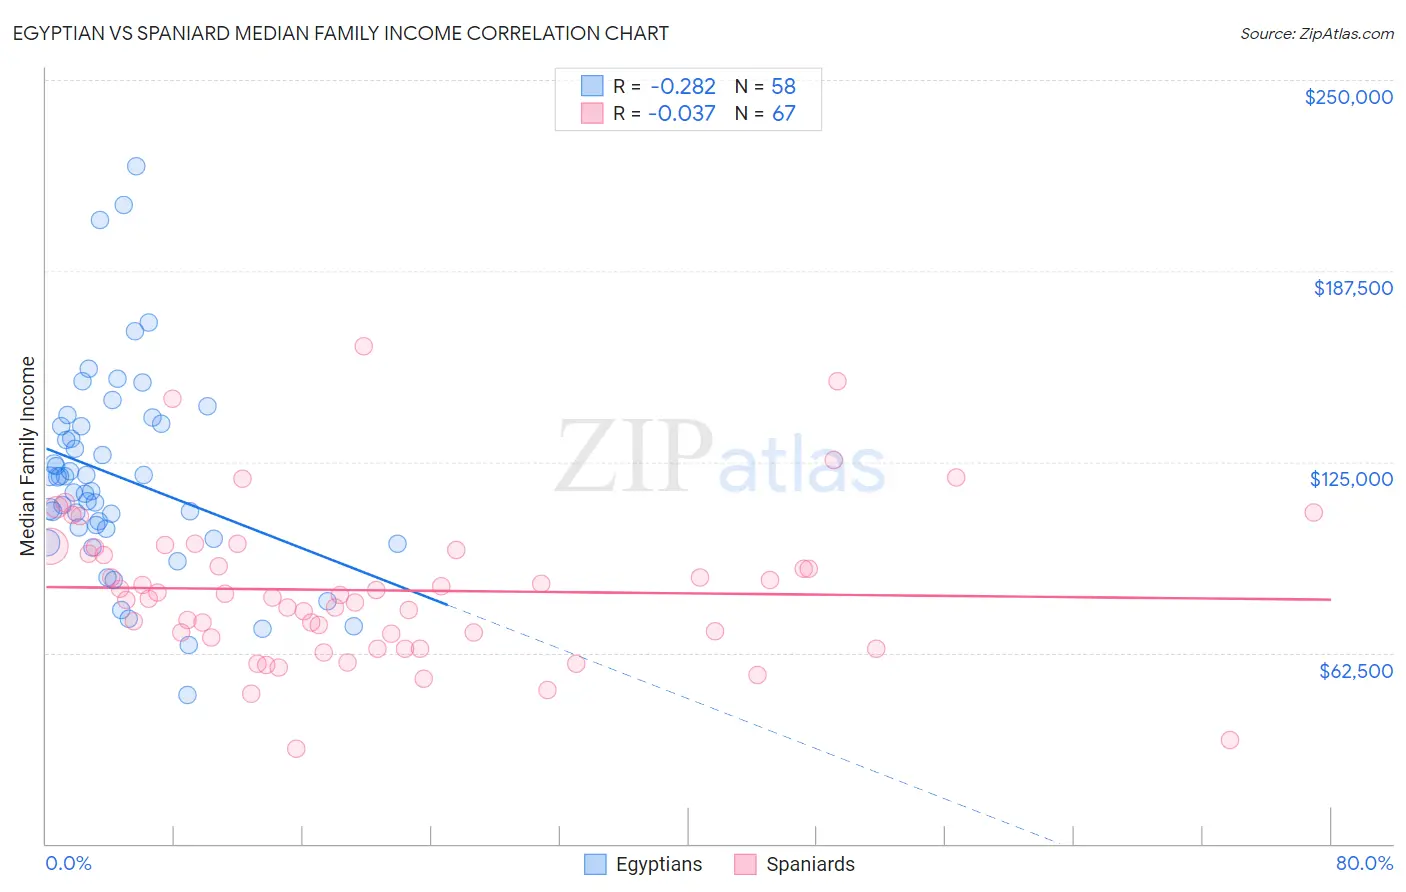
Egyptian vs Spaniard Median Family Income Correlation Chart
The statistical analysis conducted on geographies consisting of 276,687,434 people shows a weak negative correlation between the proportion of Egyptians and median family income in the United States with a correlation coefficient (R) of -0.282 and weighted average of $114,119. Similarly, the statistical analysis conducted on geographies consisting of 442,935,901 people shows no correlation between the proportion of Spaniards and median family income in the United States with a correlation coefficient (R) of -0.037 and weighted average of $101,617, a difference of 12.3%.
Median Family Income Correlation Summary
| Measurement | Egyptian | Spaniard |
| Minimum | $48,661 | $31,232 |
| Maximum | $221,912 | $162,957 |
| Range | $173,251 | $131,725 |
| Mean | $119,991 | $82,984 |
| Median | $117,654 | $80,417 |
| Interquartile 25% (IQ1) | $103,125 | $67,468 |
| Interquartile 75% (IQ3) | $136,794 | $96,250 |
| Interquartile Range (IQR) | $33,669 | $28,782 |
| Standard Deviation (Sample) | $33,329 | $24,669 |
| Standard Deviation (Population) | $33,040 | $24,485 |
Similar Demographics by Median Family Income
Demographics Similar to Egyptians by Median Family Income
In terms of median family income, the demographic groups most similar to Egyptians are Paraguayan ($114,016, a difference of 0.090%), Immigrants from Scotland ($114,392, a difference of 0.24%), Immigrants from Pakistan ($114,406, a difference of 0.25%), Immigrants from Spain ($113,815, a difference of 0.27%), and Mongolian ($114,553, a difference of 0.38%).
| Demographics | Rating | Rank | Median Family Income |
| Immigrants | Indonesia | 99.8 /100 | #58 | Exceptional $115,162 |
| Immigrants | Netherlands | 99.8 /100 | #59 | Exceptional $114,987 |
| Immigrants | Latvia | 99.8 /100 | #60 | Exceptional $114,826 |
| Immigrants | Belarus | 99.8 /100 | #61 | Exceptional $114,586 |
| Mongolians | 99.8 /100 | #62 | Exceptional $114,553 |
| Immigrants | Pakistan | 99.8 /100 | #63 | Exceptional $114,406 |
| Immigrants | Scotland | 99.7 /100 | #64 | Exceptional $114,392 |
| Egyptians | 99.7 /100 | #65 | Exceptional $114,119 |
| Paraguayans | 99.7 /100 | #66 | Exceptional $114,016 |
| Immigrants | Spain | 99.7 /100 | #67 | Exceptional $113,815 |
| Immigrants | Serbia | 99.6 /100 | #68 | Exceptional $113,463 |
| Immigrants | Bulgaria | 99.6 /100 | #69 | Exceptional $113,461 |
| Immigrants | Romania | 99.6 /100 | #70 | Exceptional $113,434 |
| South Africans | 99.5 /100 | #71 | Exceptional $113,229 |
| Afghans | 99.5 /100 | #72 | Exceptional $112,971 |
Demographics Similar to Spaniards by Median Family Income
In terms of median family income, the demographic groups most similar to Spaniards are French Canadian ($101,634, a difference of 0.020%), Tsimshian ($101,543, a difference of 0.070%), Kenyan ($101,417, a difference of 0.20%), South American ($101,856, a difference of 0.23%), and Immigrants from Costa Rica ($101,354, a difference of 0.26%).
| Demographics | Rating | Rank | Median Family Income |
| Finns | 50.0 /100 | #174 | Average $102,676 |
| Immigrants | Eastern Africa | 47.1 /100 | #175 | Average $102,451 |
| French | 46.1 /100 | #176 | Average $102,368 |
| Germans | 44.6 /100 | #177 | Average $102,254 |
| Welsh | 43.3 /100 | #178 | Average $102,151 |
| South Americans | 39.7 /100 | #179 | Fair $101,856 |
| French Canadians | 37.0 /100 | #180 | Fair $101,634 |
| Spaniards | 36.8 /100 | #181 | Fair $101,617 |
| Tsimshian | 35.9 /100 | #182 | Fair $101,543 |
| Kenyans | 34.5 /100 | #183 | Fair $101,417 |
| Immigrants | Costa Rica | 33.7 /100 | #184 | Fair $101,354 |
| Dutch | 31.9 /100 | #185 | Fair $101,192 |
| Celtics | 31.3 /100 | #186 | Fair $101,139 |
| Tlingit-Haida | 30.8 /100 | #187 | Fair $101,092 |
| Guamanians/Chamorros | 30.5 /100 | #188 | Fair $101,061 |