Immigrants from Greece vs Spaniard Median Family Income
COMPARE
Immigrants from Greece
Spaniard
Median Family Income
Median Family Income Comparison
Immigrants from Greece
Spaniards
$117,344
MEDIAN FAMILY INCOME
99.9/ 100
METRIC RATING
45th/ 347
METRIC RANK
$101,617
MEDIAN FAMILY INCOME
36.8/ 100
METRIC RATING
181st/ 347
METRIC RANK
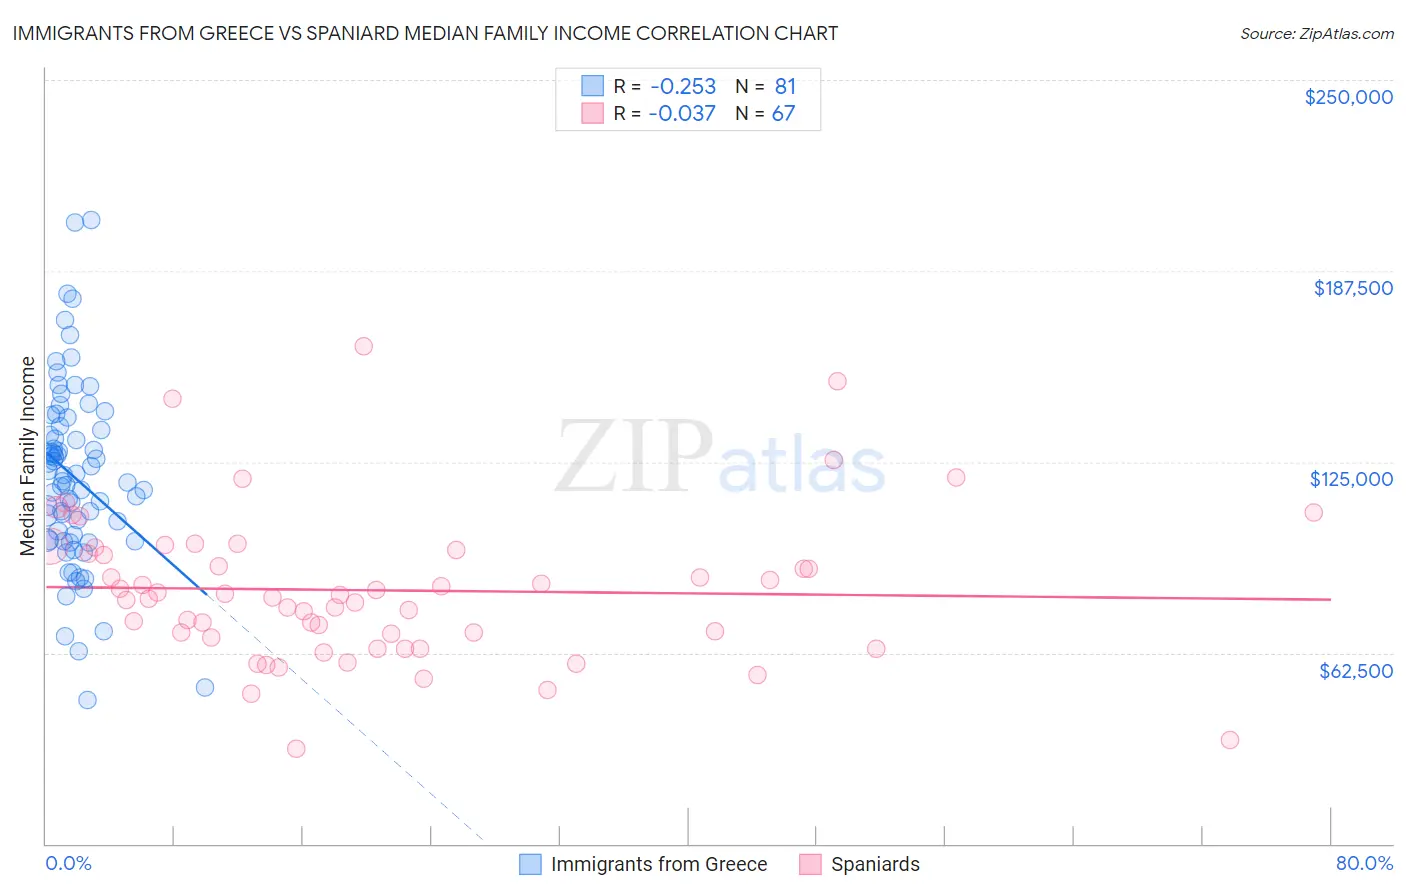
Immigrants from Greece vs Spaniard Median Family Income Correlation Chart
The statistical analysis conducted on geographies consisting of 216,841,936 people shows a weak negative correlation between the proportion of Immigrants from Greece and median family income in the United States with a correlation coefficient (R) of -0.253 and weighted average of $117,344. Similarly, the statistical analysis conducted on geographies consisting of 442,935,901 people shows no correlation between the proportion of Spaniards and median family income in the United States with a correlation coefficient (R) of -0.037 and weighted average of $101,617, a difference of 15.5%.
Median Family Income Correlation Summary
| Measurement | Immigrants from Greece | Spaniard |
| Minimum | $46,875 | $31,232 |
| Maximum | $204,250 | $162,957 |
| Range | $157,375 | $131,725 |
| Mean | $119,942 | $82,984 |
| Median | $118,534 | $80,417 |
| Interquartile 25% (IQ1) | $99,330 | $67,468 |
| Interquartile 75% (IQ3) | $136,059 | $96,250 |
| Interquartile Range (IQR) | $36,729 | $28,782 |
| Standard Deviation (Sample) | $29,797 | $24,669 |
| Standard Deviation (Population) | $29,612 | $24,485 |
Similar Demographics by Median Family Income
Demographics Similar to Immigrants from Greece by Median Family Income
In terms of median family income, the demographic groups most similar to Immigrants from Greece are Immigrants from Russia ($116,942, a difference of 0.34%), Cambodian ($117,780, a difference of 0.37%), Bulgarian ($117,818, a difference of 0.40%), Immigrants from Austria ($116,830, a difference of 0.44%), and Immigrants from Bolivia ($117,912, a difference of 0.48%).
| Demographics | Rating | Rank | Median Family Income |
| Immigrants | Turkey | 100.0 /100 | #38 | Exceptional $118,325 |
| Immigrants | Asia | 100.0 /100 | #39 | Exceptional $118,291 |
| Immigrants | Lithuania | 100.0 /100 | #40 | Exceptional $118,053 |
| Estonians | 100.0 /100 | #41 | Exceptional $118,013 |
| Immigrants | Bolivia | 100.0 /100 | #42 | Exceptional $117,912 |
| Bulgarians | 100.0 /100 | #43 | Exceptional $117,818 |
| Cambodians | 100.0 /100 | #44 | Exceptional $117,780 |
| Immigrants | Greece | 99.9 /100 | #45 | Exceptional $117,344 |
| Immigrants | Russia | 99.9 /100 | #46 | Exceptional $116,942 |
| Immigrants | Austria | 99.9 /100 | #47 | Exceptional $116,830 |
| Immigrants | South Africa | 99.9 /100 | #48 | Exceptional $116,286 |
| Chinese | 99.9 /100 | #49 | Exceptional $116,188 |
| Immigrants | Czechoslovakia | 99.9 /100 | #50 | Exceptional $116,165 |
| Immigrants | Malaysia | 99.9 /100 | #51 | Exceptional $115,880 |
| Maltese | 99.9 /100 | #52 | Exceptional $115,862 |
Demographics Similar to Spaniards by Median Family Income
In terms of median family income, the demographic groups most similar to Spaniards are French Canadian ($101,634, a difference of 0.020%), Tsimshian ($101,543, a difference of 0.070%), Kenyan ($101,417, a difference of 0.20%), South American ($101,856, a difference of 0.23%), and Immigrants from Costa Rica ($101,354, a difference of 0.26%).
| Demographics | Rating | Rank | Median Family Income |
| Finns | 50.0 /100 | #174 | Average $102,676 |
| Immigrants | Eastern Africa | 47.1 /100 | #175 | Average $102,451 |
| French | 46.1 /100 | #176 | Average $102,368 |
| Germans | 44.6 /100 | #177 | Average $102,254 |
| Welsh | 43.3 /100 | #178 | Average $102,151 |
| South Americans | 39.7 /100 | #179 | Fair $101,856 |
| French Canadians | 37.0 /100 | #180 | Fair $101,634 |
| Spaniards | 36.8 /100 | #181 | Fair $101,617 |
| Tsimshian | 35.9 /100 | #182 | Fair $101,543 |
| Kenyans | 34.5 /100 | #183 | Fair $101,417 |
| Immigrants | Costa Rica | 33.7 /100 | #184 | Fair $101,354 |
| Dutch | 31.9 /100 | #185 | Fair $101,192 |
| Celtics | 31.3 /100 | #186 | Fair $101,139 |
| Tlingit-Haida | 30.8 /100 | #187 | Fair $101,092 |
| Guamanians/Chamorros | 30.5 /100 | #188 | Fair $101,061 |