Irish vs Immigrants from West Indies Per Capita Income
COMPARE
Irish
Immigrants from West Indies
Per Capita Income
Per Capita Income Comparison
Irish
Immigrants from West Indies
$44,679
PER CAPITA INCOME
75.8/ 100
METRIC RATING
146th/ 347
METRIC RANK
$40,763
PER CAPITA INCOME
3.7/ 100
METRIC RATING
234th/ 347
METRIC RANK
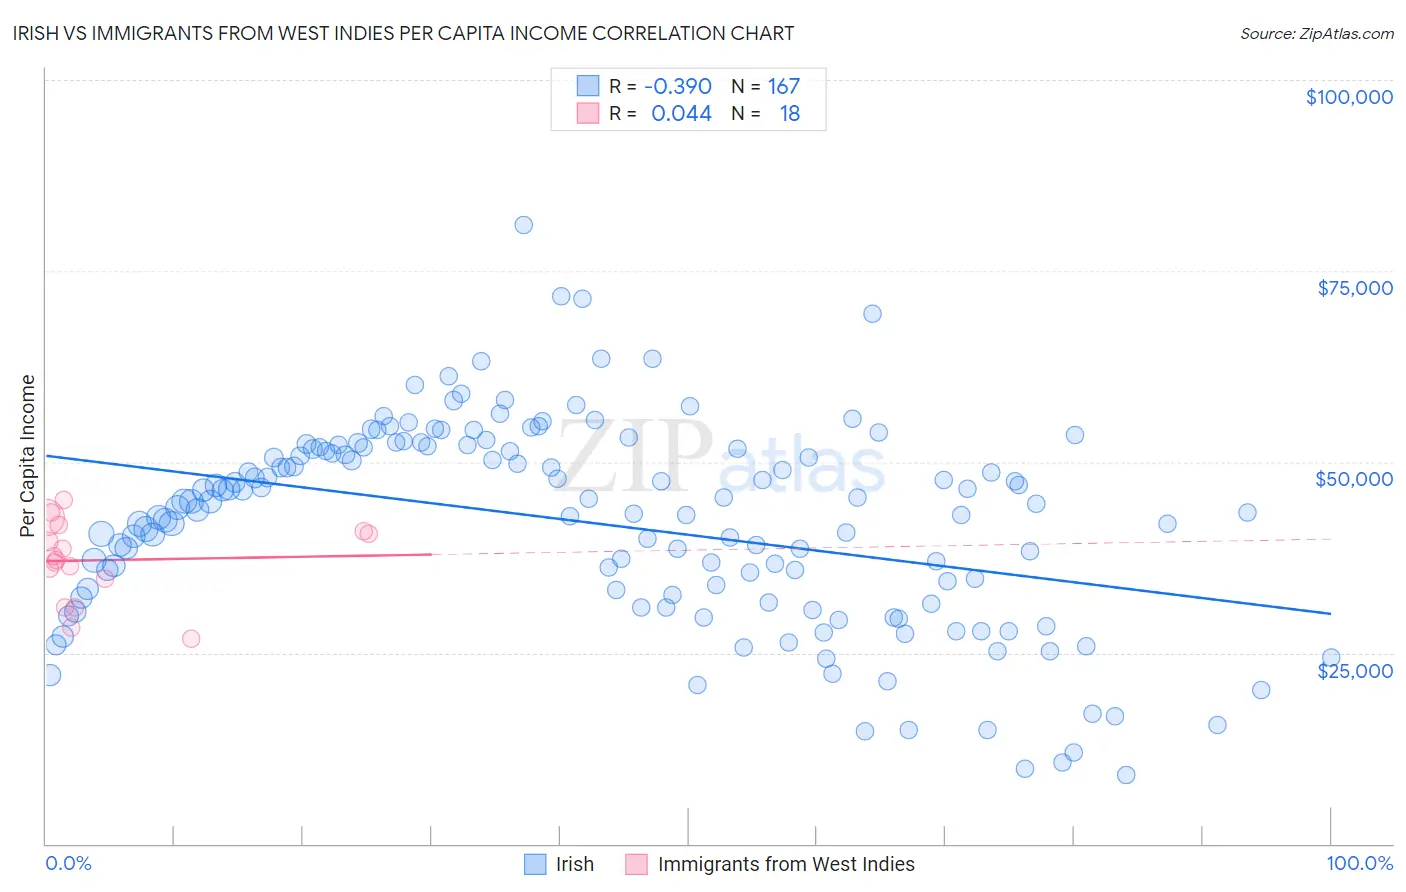
Irish vs Immigrants from West Indies Per Capita Income Correlation Chart
The statistical analysis conducted on geographies consisting of 580,769,300 people shows a mild negative correlation between the proportion of Irish and per capita income in the United States with a correlation coefficient (R) of -0.390 and weighted average of $44,679. Similarly, the statistical analysis conducted on geographies consisting of 72,420,477 people shows no correlation between the proportion of Immigrants from West Indies and per capita income in the United States with a correlation coefficient (R) of 0.044 and weighted average of $40,763, a difference of 9.6%.
Per Capita Income Correlation Summary
| Measurement | Irish | Immigrants from West Indies |
| Minimum | $9,015 | $26,894 |
| Maximum | $80,942 | $45,008 |
| Range | $71,927 | $18,114 |
| Mean | $42,054 | $37,133 |
| Median | $44,449 | $37,421 |
| Interquartile 25% (IQ1) | $32,164 | $34,659 |
| Interquartile 75% (IQ3) | $51,890 | $40,860 |
| Interquartile Range (IQR) | $19,726 | $6,201 |
| Standard Deviation (Sample) | $13,324 | $5,188 |
| Standard Deviation (Population) | $13,284 | $5,042 |
Similar Demographics by Per Capita Income
Demographics Similar to Irish by Per Capita Income
In terms of per capita income, the demographic groups most similar to Irish are Czech ($44,595, a difference of 0.19%), Immigrants from Afghanistan ($44,790, a difference of 0.25%), Immigrants from Armenia ($44,552, a difference of 0.28%), Korean ($44,522, a difference of 0.35%), and Immigrants from Eritrea ($44,509, a difference of 0.38%).
| Demographics | Rating | Rank | Per Capita Income |
| Basques | 83.2 /100 | #139 | Excellent $45,086 |
| Immigrants | Jordan | 82.9 /100 | #140 | Excellent $45,066 |
| Slavs | 82.6 /100 | #141 | Excellent $45,049 |
| Ugandans | 82.6 /100 | #142 | Excellent $45,047 |
| Immigrants | Uganda | 82.5 /100 | #143 | Excellent $45,043 |
| Icelanders | 81.6 /100 | #144 | Excellent $44,987 |
| Immigrants | Afghanistan | 78.0 /100 | #145 | Good $44,790 |
| Irish | 75.8 /100 | #146 | Good $44,679 |
| Czechs | 74.1 /100 | #147 | Good $44,595 |
| Immigrants | Armenia | 73.1 /100 | #148 | Good $44,552 |
| Koreans | 72.5 /100 | #149 | Good $44,522 |
| Immigrants | Eritrea | 72.1 /100 | #150 | Good $44,509 |
| Norwegians | 71.5 /100 | #151 | Good $44,480 |
| Peruvians | 71.5 /100 | #152 | Good $44,479 |
| Scottish | 70.6 /100 | #153 | Good $44,440 |
Demographics Similar to Immigrants from West Indies by Per Capita Income
In terms of per capita income, the demographic groups most similar to Immigrants from West Indies are Delaware ($40,778, a difference of 0.040%), Immigrants from Guyana ($40,742, a difference of 0.050%), Nonimmigrants ($40,669, a difference of 0.23%), Guyanese ($40,949, a difference of 0.46%), and Senegalese ($41,000, a difference of 0.58%).
| Demographics | Rating | Rank | Per Capita Income |
| Immigrants | Ghana | 5.5 /100 | #227 | Tragic $41,131 |
| Immigrants | Grenada | 5.5 /100 | #228 | Tragic $41,123 |
| Nigerians | 4.9 /100 | #229 | Tragic $41,026 |
| Native Hawaiians | 4.9 /100 | #230 | Tragic $41,017 |
| Senegalese | 4.8 /100 | #231 | Tragic $41,000 |
| Guyanese | 4.5 /100 | #232 | Tragic $40,949 |
| Delaware | 3.8 /100 | #233 | Tragic $40,778 |
| Immigrants | West Indies | 3.7 /100 | #234 | Tragic $40,763 |
| Immigrants | Guyana | 3.6 /100 | #235 | Tragic $40,742 |
| Immigrants | Nonimmigrants | 3.4 /100 | #236 | Tragic $40,669 |
| Immigrants | Cambodia | 2.6 /100 | #237 | Tragic $40,434 |
| Somalis | 2.4 /100 | #238 | Tragic $40,367 |
| Tsimshian | 2.4 /100 | #239 | Tragic $40,344 |
| Immigrants | Nigeria | 2.3 /100 | #240 | Tragic $40,339 |
| British West Indians | 2.3 /100 | #241 | Tragic $40,330 |