Immigrants from Australia vs Immigrants from West Indies Per Capita Income
COMPARE
Immigrants from Australia
Immigrants from West Indies
Per Capita Income
Per Capita Income Comparison
Immigrants from Australia
Immigrants from West Indies
$57,953
PER CAPITA INCOME
100.0/ 100
METRIC RATING
4th/ 347
METRIC RANK
$40,763
PER CAPITA INCOME
3.7/ 100
METRIC RATING
234th/ 347
METRIC RANK
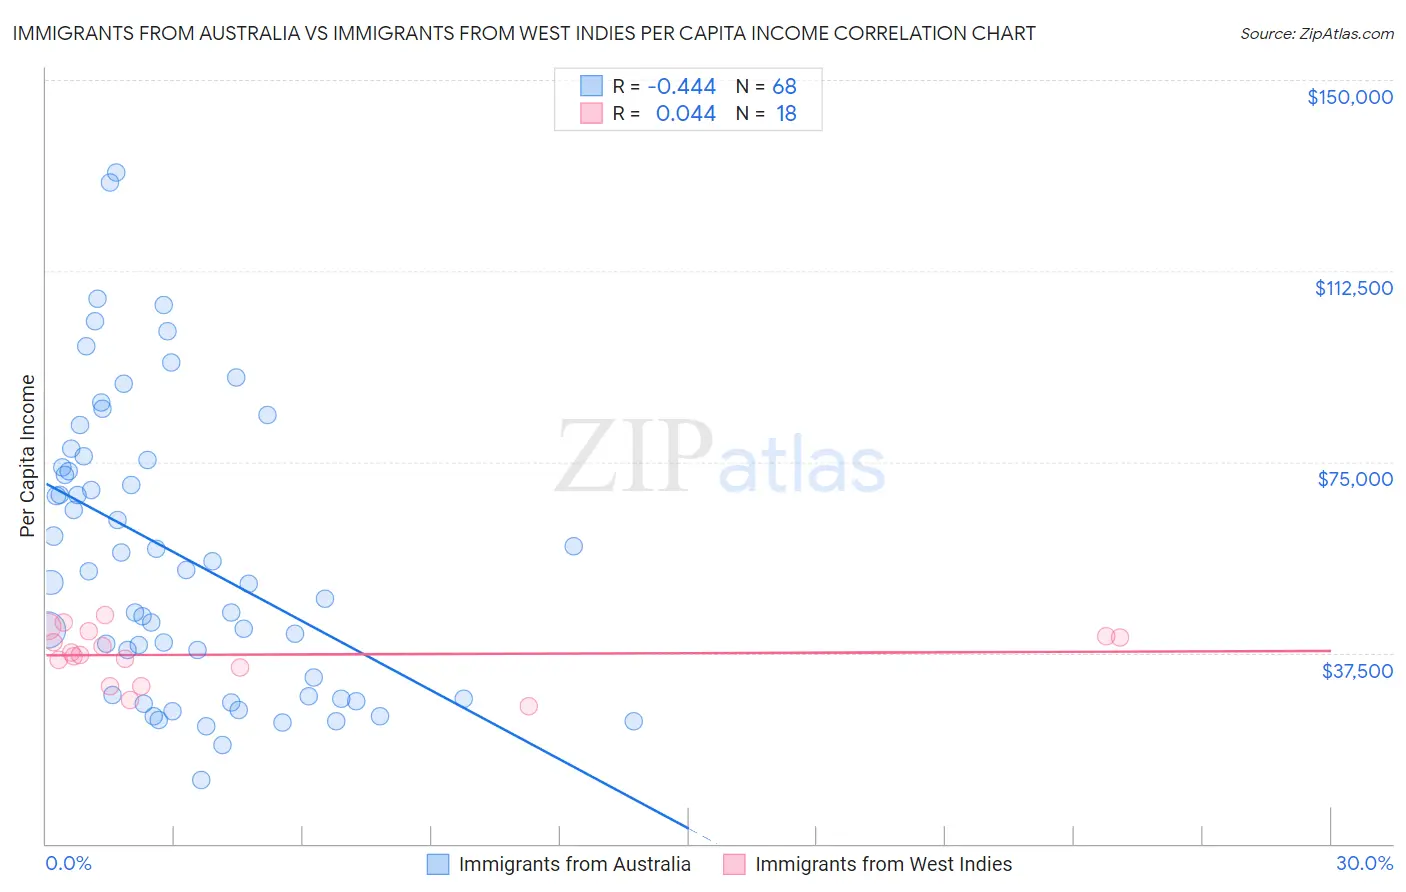
Immigrants from Australia vs Immigrants from West Indies Per Capita Income Correlation Chart
The statistical analysis conducted on geographies consisting of 227,208,257 people shows a moderate negative correlation between the proportion of Immigrants from Australia and per capita income in the United States with a correlation coefficient (R) of -0.444 and weighted average of $57,953. Similarly, the statistical analysis conducted on geographies consisting of 72,420,477 people shows no correlation between the proportion of Immigrants from West Indies and per capita income in the United States with a correlation coefficient (R) of 0.044 and weighted average of $40,763, a difference of 42.2%.
Per Capita Income Correlation Summary
| Measurement | Immigrants from Australia | Immigrants from West Indies |
| Minimum | $12,597 | $26,894 |
| Maximum | $131,905 | $45,008 |
| Range | $119,308 | $18,114 |
| Mean | $56,529 | $37,133 |
| Median | $52,474 | $37,421 |
| Interquartile 25% (IQ1) | $28,994 | $34,659 |
| Interquartile 75% (IQ3) | $74,709 | $40,860 |
| Interquartile Range (IQR) | $45,716 | $6,201 |
| Standard Deviation (Sample) | $28,217 | $5,188 |
| Standard Deviation (Population) | $28,008 | $5,042 |
Similar Demographics by Per Capita Income
Demographics Similar to Immigrants from Australia by Per Capita Income
In terms of per capita income, the demographic groups most similar to Immigrants from Australia are Immigrants from Iran ($57,759, a difference of 0.34%), Immigrants from Taiwan ($57,742, a difference of 0.37%), Immigrants from Singapore ($58,353, a difference of 0.69%), Immigrants from Israel ($57,384, a difference of 0.99%), and Iranian ($58,786, a difference of 1.4%).
| Demographics | Rating | Rank | Per Capita Income |
| Filipinos | 100.0 /100 | #1 | Exceptional $59,066 |
| Iranians | 100.0 /100 | #2 | Exceptional $58,786 |
| Immigrants | Singapore | 100.0 /100 | #3 | Exceptional $58,353 |
| Immigrants | Australia | 100.0 /100 | #4 | Exceptional $57,953 |
| Immigrants | Iran | 100.0 /100 | #5 | Exceptional $57,759 |
| Immigrants | Taiwan | 100.0 /100 | #6 | Exceptional $57,742 |
| Immigrants | Israel | 100.0 /100 | #7 | Exceptional $57,384 |
| Immigrants | Hong Kong | 100.0 /100 | #8 | Exceptional $56,709 |
| Immigrants | Ireland | 100.0 /100 | #9 | Exceptional $56,584 |
| Okinawans | 100.0 /100 | #10 | Exceptional $55,817 |
| Eastern Europeans | 100.0 /100 | #11 | Exceptional $55,780 |
| Immigrants | Sweden | 100.0 /100 | #12 | Exceptional $55,582 |
| Immigrants | India | 100.0 /100 | #13 | Exceptional $55,268 |
| Immigrants | Belgium | 100.0 /100 | #14 | Exceptional $55,082 |
| Cypriots | 100.0 /100 | #15 | Exceptional $54,899 |
Demographics Similar to Immigrants from West Indies by Per Capita Income
In terms of per capita income, the demographic groups most similar to Immigrants from West Indies are Delaware ($40,778, a difference of 0.040%), Immigrants from Guyana ($40,742, a difference of 0.050%), Nonimmigrants ($40,669, a difference of 0.23%), Guyanese ($40,949, a difference of 0.46%), and Senegalese ($41,000, a difference of 0.58%).
| Demographics | Rating | Rank | Per Capita Income |
| Immigrants | Ghana | 5.5 /100 | #227 | Tragic $41,131 |
| Immigrants | Grenada | 5.5 /100 | #228 | Tragic $41,123 |
| Nigerians | 4.9 /100 | #229 | Tragic $41,026 |
| Native Hawaiians | 4.9 /100 | #230 | Tragic $41,017 |
| Senegalese | 4.8 /100 | #231 | Tragic $41,000 |
| Guyanese | 4.5 /100 | #232 | Tragic $40,949 |
| Delaware | 3.8 /100 | #233 | Tragic $40,778 |
| Immigrants | West Indies | 3.7 /100 | #234 | Tragic $40,763 |
| Immigrants | Guyana | 3.6 /100 | #235 | Tragic $40,742 |
| Immigrants | Nonimmigrants | 3.4 /100 | #236 | Tragic $40,669 |
| Immigrants | Cambodia | 2.6 /100 | #237 | Tragic $40,434 |
| Somalis | 2.4 /100 | #238 | Tragic $40,367 |
| Tsimshian | 2.4 /100 | #239 | Tragic $40,344 |
| Immigrants | Nigeria | 2.3 /100 | #240 | Tragic $40,339 |
| British West Indians | 2.3 /100 | #241 | Tragic $40,330 |