Scandinavian vs Immigrants from Bolivia Median Household Income
COMPARE
Scandinavian
Immigrants from Bolivia
Median Household Income
Median Household Income Comparison
Scandinavians
Immigrants from Bolivia
$86,073
MEDIAN HOUSEHOLD INCOME
65.1/ 100
METRIC RATING
166th/ 347
METRIC RANK
$101,394
MEDIAN HOUSEHOLD INCOME
100.0/ 100
METRIC RATING
23rd/ 347
METRIC RANK
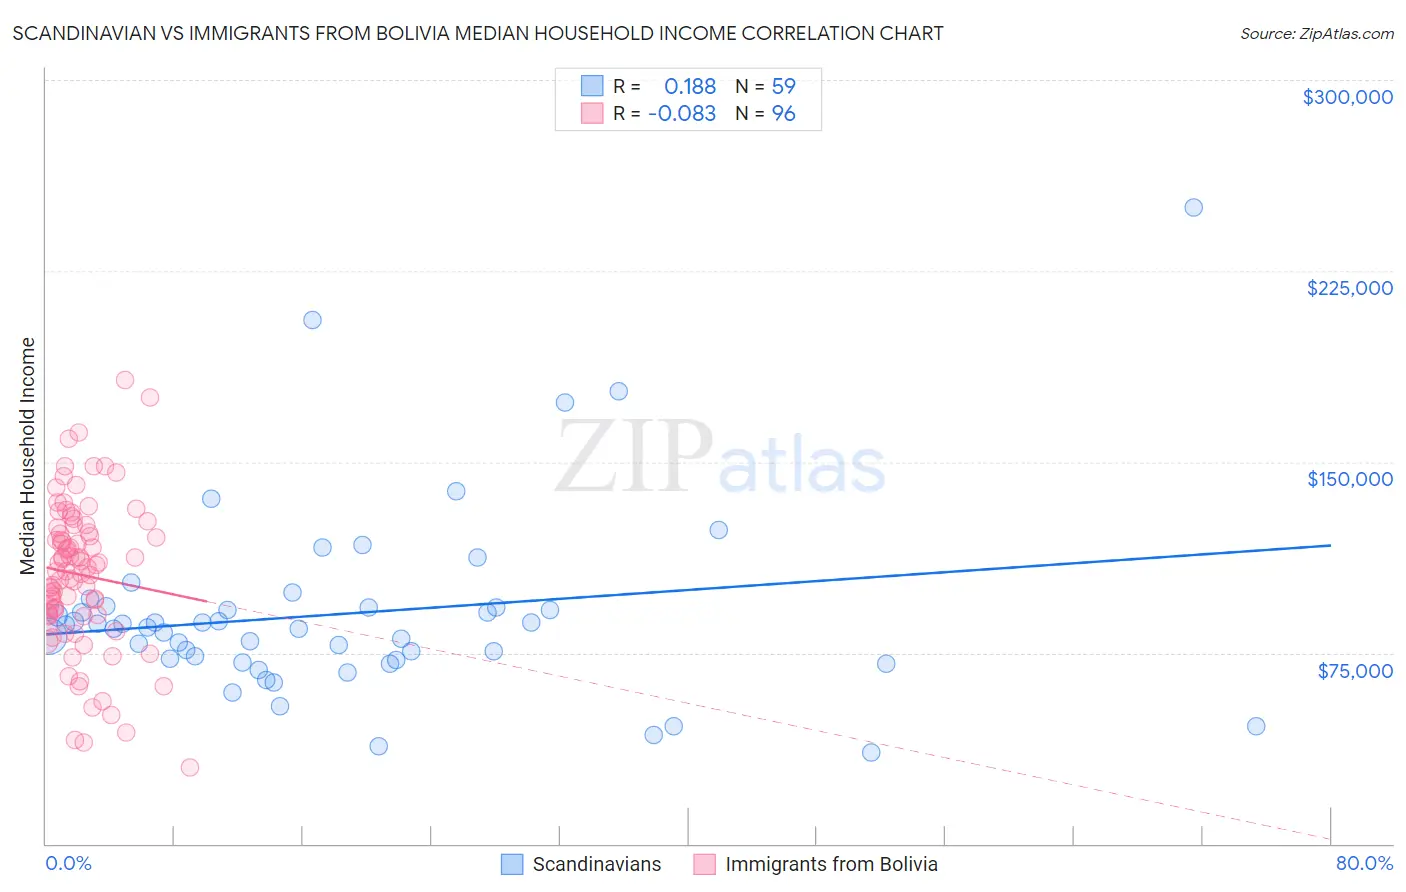
Scandinavian vs Immigrants from Bolivia Median Household Income Correlation Chart
The statistical analysis conducted on geographies consisting of 472,110,165 people shows a poor positive correlation between the proportion of Scandinavians and median household income in the United States with a correlation coefficient (R) of 0.188 and weighted average of $86,073. Similarly, the statistical analysis conducted on geographies consisting of 158,713,567 people shows a slight negative correlation between the proportion of Immigrants from Bolivia and median household income in the United States with a correlation coefficient (R) of -0.083 and weighted average of $101,394, a difference of 17.8%.
Median Household Income Correlation Summary
| Measurement | Scandinavian | Immigrants from Bolivia |
| Minimum | $35,625 | $29,844 |
| Maximum | $250,001 | $182,250 |
| Range | $214,376 | $152,406 |
| Mean | $90,420 | $105,682 |
| Median | $84,951 | $107,900 |
| Interquartile 25% (IQ1) | $72,386 | $89,971 |
| Interquartile 75% (IQ3) | $92,885 | $123,106 |
| Interquartile Range (IQR) | $20,499 | $33,135 |
| Standard Deviation (Sample) | $37,436 | $29,190 |
| Standard Deviation (Population) | $37,118 | $29,037 |
Similar Demographics by Median Household Income
Demographics Similar to Scandinavians by Median Household Income
In terms of median household income, the demographic groups most similar to Scandinavians are Norwegian ($86,084, a difference of 0.010%), Irish ($86,145, a difference of 0.080%), Czech ($86,164, a difference of 0.11%), Guamanian/Chamorro ($86,255, a difference of 0.21%), and Immigrants ($85,818, a difference of 0.30%).
| Demographics | Rating | Rank | Median Household Income |
| Immigrants | Uzbekistan | 70.1 /100 | #159 | Good $86,425 |
| Luxembourgers | 70.0 /100 | #160 | Good $86,418 |
| Slavs | 69.7 /100 | #161 | Good $86,398 |
| Guamanians/Chamorros | 67.7 /100 | #162 | Good $86,255 |
| Czechs | 66.4 /100 | #163 | Good $86,164 |
| Irish | 66.2 /100 | #164 | Good $86,145 |
| Norwegians | 65.3 /100 | #165 | Good $86,084 |
| Scandinavians | 65.1 /100 | #166 | Good $86,073 |
| Immigrants | Immigrants | 61.3 /100 | #167 | Good $85,818 |
| Icelanders | 61.0 /100 | #168 | Good $85,797 |
| Colombians | 59.7 /100 | #169 | Average $85,716 |
| Swiss | 59.2 /100 | #170 | Average $85,681 |
| Immigrants | South America | 58.1 /100 | #171 | Average $85,611 |
| Slovenes | 57.4 /100 | #172 | Average $85,562 |
| Immigrants | Cameroon | 53.4 /100 | #173 | Average $85,314 |
Demographics Similar to Immigrants from Bolivia by Median Household Income
In terms of median household income, the demographic groups most similar to Immigrants from Bolivia are Asian ($101,681, a difference of 0.28%), Eastern European ($101,781, a difference of 0.38%), Immigrants from Japan ($100,711, a difference of 0.68%), Immigrants from Sweden ($100,699, a difference of 0.69%), and Bolivian ($102,195, a difference of 0.79%).
| Demographics | Rating | Rank | Median Household Income |
| Burmese | 100.0 /100 | #16 | Exceptional $103,145 |
| Immigrants | Korea | 100.0 /100 | #17 | Exceptional $102,962 |
| Cypriots | 100.0 /100 | #18 | Exceptional $102,843 |
| Immigrants | Australia | 100.0 /100 | #19 | Exceptional $102,562 |
| Bolivians | 100.0 /100 | #20 | Exceptional $102,195 |
| Eastern Europeans | 100.0 /100 | #21 | Exceptional $101,781 |
| Asians | 100.0 /100 | #22 | Exceptional $101,681 |
| Immigrants | Bolivia | 100.0 /100 | #23 | Exceptional $101,394 |
| Immigrants | Japan | 100.0 /100 | #24 | Exceptional $100,711 |
| Immigrants | Sweden | 100.0 /100 | #25 | Exceptional $100,699 |
| Immigrants | Belgium | 100.0 /100 | #26 | Exceptional $100,306 |
| Bhutanese | 100.0 /100 | #27 | Exceptional $100,151 |
| Immigrants | Sri Lanka | 100.0 /100 | #28 | Exceptional $99,943 |
| Immigrants | Asia | 100.0 /100 | #29 | Exceptional $99,933 |
| Immigrants | Northern Europe | 100.0 /100 | #30 | Exceptional $99,813 |