Sudanese vs Immigrants from Bolivia Ambulatory Disability
COMPARE
Sudanese
Immigrants from Bolivia
Ambulatory Disability
Ambulatory Disability Comparison
Sudanese
Immigrants from Bolivia
5.7%
AMBULATORY DISABILITY
99.3/ 100
METRIC RATING
76th/ 347
METRIC RANK
5.0%
AMBULATORY DISABILITY
100.0/ 100
METRIC RATING
6th/ 347
METRIC RANK
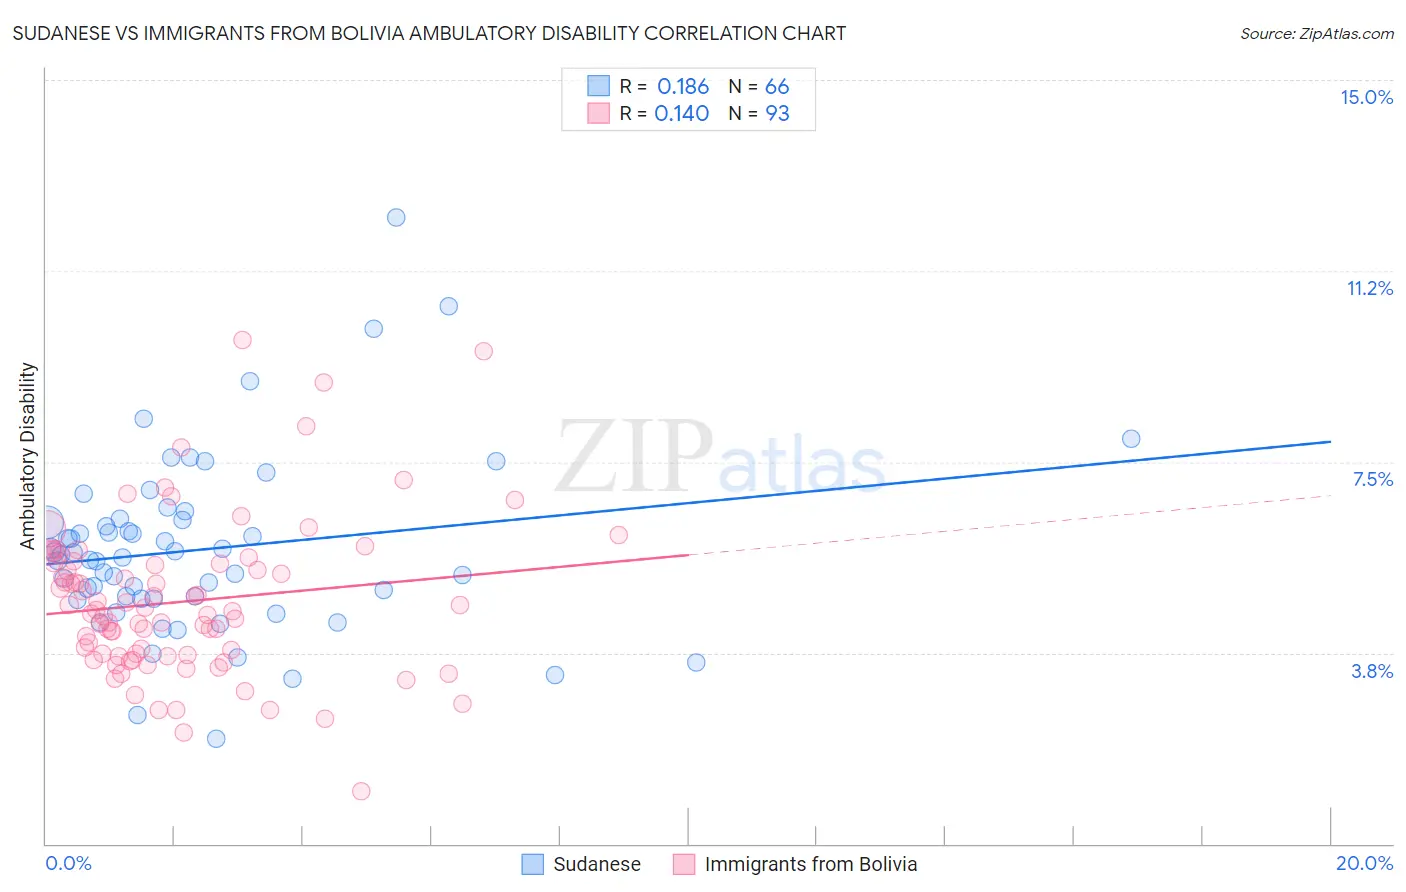
Sudanese vs Immigrants from Bolivia Ambulatory Disability Correlation Chart
The statistical analysis conducted on geographies consisting of 110,129,493 people shows a poor positive correlation between the proportion of Sudanese and percentage of population with ambulatory disability in the United States with a correlation coefficient (R) of 0.186 and weighted average of 5.7%. Similarly, the statistical analysis conducted on geographies consisting of 158,713,852 people shows a poor positive correlation between the proportion of Immigrants from Bolivia and percentage of population with ambulatory disability in the United States with a correlation coefficient (R) of 0.140 and weighted average of 5.0%, a difference of 13.4%.
Ambulatory Disability Correlation Summary
| Measurement | Sudanese | Immigrants from Bolivia |
| Minimum | 2.1% | 1.0% |
| Maximum | 12.3% | 9.9% |
| Range | 10.2% | 8.8% |
| Mean | 5.8% | 4.8% |
| Median | 5.6% | 4.6% |
| Interquartile 25% (IQ1) | 4.8% | 3.7% |
| Interquartile 75% (IQ3) | 6.3% | 5.5% |
| Interquartile Range (IQR) | 1.5% | 1.8% |
| Standard Deviation (Sample) | 1.8% | 1.5% |
| Standard Deviation (Population) | 1.7% | 1.5% |
Similar Demographics by Ambulatory Disability
Demographics Similar to Sudanese by Ambulatory Disability
In terms of ambulatory disability, the demographic groups most similar to Sudanese are Immigrants from South Africa (5.7%, a difference of 0.020%), Immigrants from Cameroon (5.7%, a difference of 0.070%), Immigrants from Northern Africa (5.7%, a difference of 0.080%), Brazilian (5.7%, a difference of 0.090%), and Immigrants from Peru (5.7%, a difference of 0.12%).
| Demographics | Rating | Rank | Ambulatory Disability |
| Peruvians | 99.5 /100 | #69 | Exceptional 5.7% |
| Sierra Leoneans | 99.4 /100 | #70 | Exceptional 5.7% |
| Immigrants | Peru | 99.4 /100 | #71 | Exceptional 5.7% |
| Brazilians | 99.4 /100 | #72 | Exceptional 5.7% |
| Immigrants | Northern Africa | 99.4 /100 | #73 | Exceptional 5.7% |
| Immigrants | Cameroon | 99.4 /100 | #74 | Exceptional 5.7% |
| Immigrants | South Africa | 99.3 /100 | #75 | Exceptional 5.7% |
| Sudanese | 99.3 /100 | #76 | Exceptional 5.7% |
| Immigrants | Vietnam | 99.3 /100 | #77 | Exceptional 5.7% |
| Somalis | 99.2 /100 | #78 | Exceptional 5.7% |
| Chileans | 99.2 /100 | #79 | Exceptional 5.7% |
| Immigrants | Ireland | 99.2 /100 | #80 | Exceptional 5.7% |
| Immigrants | Jordan | 99.2 /100 | #81 | Exceptional 5.7% |
| Palestinians | 99.2 /100 | #82 | Exceptional 5.7% |
| Eastern Europeans | 99.2 /100 | #83 | Exceptional 5.7% |
Demographics Similar to Immigrants from Bolivia by Ambulatory Disability
In terms of ambulatory disability, the demographic groups most similar to Immigrants from Bolivia are Bolivian (5.1%, a difference of 0.38%), Immigrants from Singapore (5.0%, a difference of 0.68%), Immigrants from South Central Asia (5.1%, a difference of 1.4%), Iranian (5.1%, a difference of 1.7%), and Immigrants from Taiwan (4.9%, a difference of 2.1%).
| Demographics | Rating | Rank | Ambulatory Disability |
| Immigrants | India | 100.0 /100 | #1 | Exceptional 4.8% |
| Filipinos | 100.0 /100 | #2 | Exceptional 4.9% |
| Thais | 100.0 /100 | #3 | Exceptional 4.9% |
| Immigrants | Taiwan | 100.0 /100 | #4 | Exceptional 4.9% |
| Immigrants | Singapore | 100.0 /100 | #5 | Exceptional 5.0% |
| Immigrants | Bolivia | 100.0 /100 | #6 | Exceptional 5.0% |
| Bolivians | 100.0 /100 | #7 | Exceptional 5.1% |
| Immigrants | South Central Asia | 100.0 /100 | #8 | Exceptional 5.1% |
| Iranians | 100.0 /100 | #9 | Exceptional 5.1% |
| Yup'ik | 100.0 /100 | #10 | Exceptional 5.2% |
| Immigrants | Korea | 100.0 /100 | #11 | Exceptional 5.2% |
| Okinawans | 100.0 /100 | #12 | Exceptional 5.3% |
| Burmese | 100.0 /100 | #13 | Exceptional 5.3% |
| Immigrants | Eastern Asia | 100.0 /100 | #14 | Exceptional 5.3% |
| Immigrants | China | 100.0 /100 | #15 | Exceptional 5.3% |