Subsaharan African vs Immigrants from Cambodia College, 1 year or more
COMPARE
Subsaharan African
Immigrants from Cambodia
College, 1 year or more
College, 1 year or more Comparison
Sub-Saharan Africans
Immigrants from Cambodia
57.3%
COLLEGE, 1 YEAR OR MORE
6.1/ 100
METRIC RATING
222nd/ 347
METRIC RANK
55.4%
COLLEGE, 1 YEAR OR MORE
0.6/ 100
METRIC RATING
251st/ 347
METRIC RANK
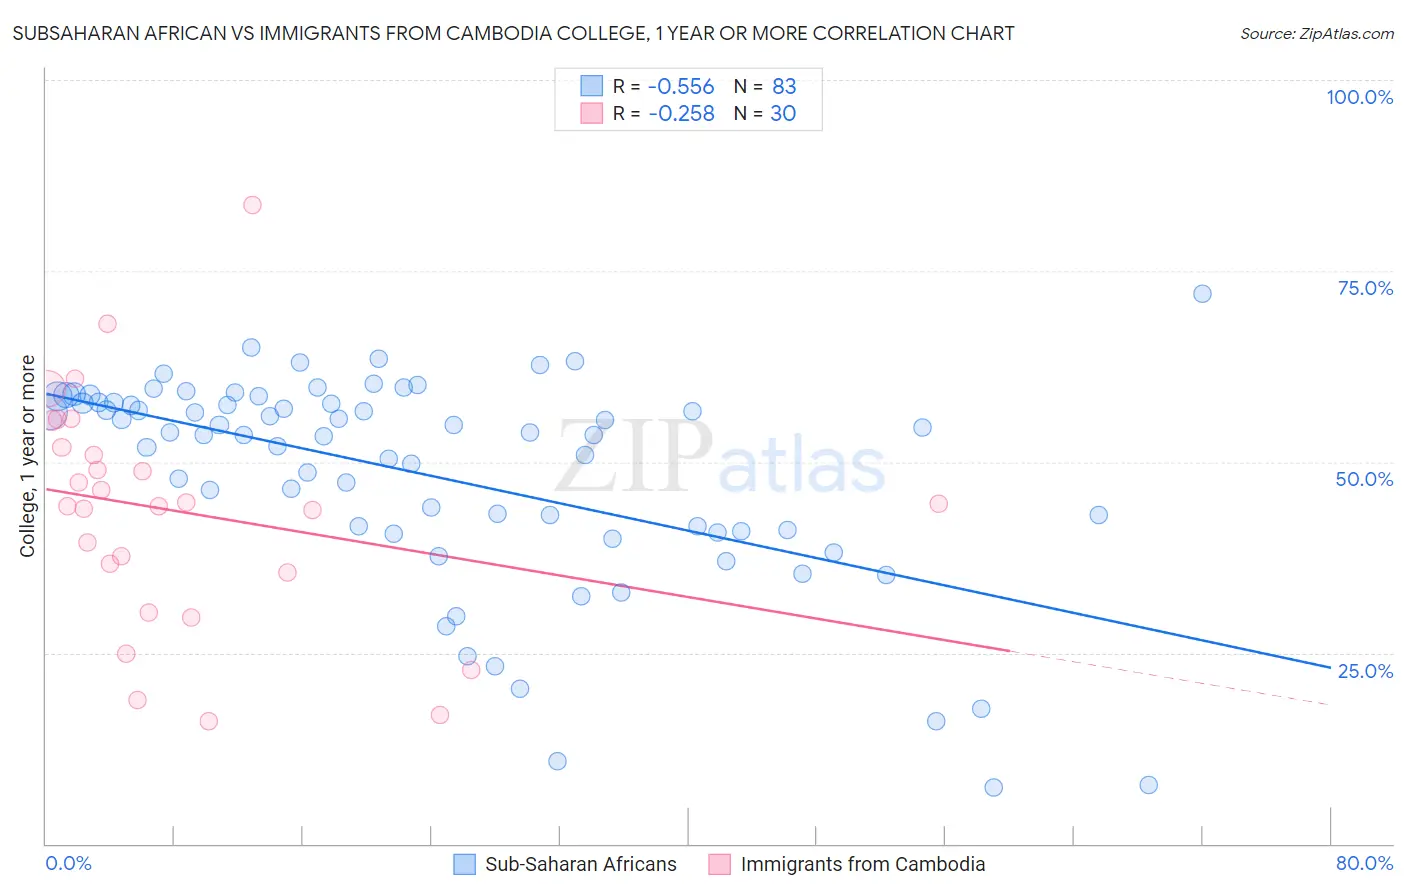
Subsaharan African vs Immigrants from Cambodia College, 1 year or more Correlation Chart
The statistical analysis conducted on geographies consisting of 508,212,148 people shows a substantial negative correlation between the proportion of Sub-Saharan Africans and percentage of population with at least college, 1 year or more education in the United States with a correlation coefficient (R) of -0.556 and weighted average of 57.3%. Similarly, the statistical analysis conducted on geographies consisting of 205,153,442 people shows a weak negative correlation between the proportion of Immigrants from Cambodia and percentage of population with at least college, 1 year or more education in the United States with a correlation coefficient (R) of -0.258 and weighted average of 55.4%, a difference of 3.3%.
College, 1 year or more Correlation Summary
| Measurement | Subsaharan African | Immigrants from Cambodia |
| Minimum | 7.4% | 16.1% |
| Maximum | 72.0% | 83.7% |
| Range | 64.6% | 67.6% |
| Mean | 48.2% | 43.5% |
| Median | 53.5% | 44.3% |
| Interquartile 25% (IQ1) | 40.9% | 35.5% |
| Interquartile 75% (IQ3) | 57.8% | 51.9% |
| Interquartile Range (IQR) | 16.8% | 16.4% |
| Standard Deviation (Sample) | 14.0% | 15.3% |
| Standard Deviation (Population) | 13.9% | 15.1% |
Similar Demographics by College, 1 year or more
Demographics Similar to Sub-Saharan Africans by College, 1 year or more
In terms of college, 1 year or more, the demographic groups most similar to Sub-Saharan Africans are Portuguese (57.2%, a difference of 0.17%), Hmong (57.2%, a difference of 0.17%), Immigrants from Ghana (57.4%, a difference of 0.34%), Vietnamese (57.0%, a difference of 0.38%), and Immigrants from Western Africa (57.0%, a difference of 0.40%).
| Demographics | Rating | Rank | College, 1 year or more |
| Tongans | 11.6 /100 | #215 | Poor 57.8% |
| Immigrants | Peru | 10.6 /100 | #216 | Poor 57.7% |
| Immigrants | Panama | 9.1 /100 | #217 | Tragic 57.6% |
| Native Hawaiians | 9.0 /100 | #218 | Tragic 57.6% |
| Whites/Caucasians | 8.7 /100 | #219 | Tragic 57.6% |
| Immigrants | Costa Rica | 8.0 /100 | #220 | Tragic 57.5% |
| Immigrants | Ghana | 7.7 /100 | #221 | Tragic 57.4% |
| Sub-Saharan Africans | 6.1 /100 | #222 | Tragic 57.3% |
| Portuguese | 5.4 /100 | #223 | Tragic 57.2% |
| Hmong | 5.4 /100 | #224 | Tragic 57.2% |
| Vietnamese | 4.7 /100 | #225 | Tragic 57.0% |
| Immigrants | Western Africa | 4.6 /100 | #226 | Tragic 57.0% |
| Immigrants | Immigrants | 4.4 /100 | #227 | Tragic 57.0% |
| Immigrants | Fiji | 4.0 /100 | #228 | Tragic 56.9% |
| Cree | 3.6 /100 | #229 | Tragic 56.8% |
Demographics Similar to Immigrants from Cambodia by College, 1 year or more
In terms of college, 1 year or more, the demographic groups most similar to Immigrants from Cambodia are Aleut (55.4%, a difference of 0.030%), Delaware (55.5%, a difference of 0.090%), Immigrants from Trinidad and Tobago (55.5%, a difference of 0.11%), Immigrants from Barbados (55.4%, a difference of 0.13%), and Immigrants from Congo (55.6%, a difference of 0.21%).
| Demographics | Rating | Rank | College, 1 year or more |
| Chippewa | 0.9 /100 | #244 | Tragic 55.7% |
| Immigrants | Liberia | 0.8 /100 | #245 | Tragic 55.7% |
| Malaysians | 0.8 /100 | #246 | Tragic 55.6% |
| Hawaiians | 0.8 /100 | #247 | Tragic 55.6% |
| Immigrants | Congo | 0.8 /100 | #248 | Tragic 55.6% |
| Immigrants | Trinidad and Tobago | 0.7 /100 | #249 | Tragic 55.5% |
| Delaware | 0.7 /100 | #250 | Tragic 55.5% |
| Immigrants | Cambodia | 0.6 /100 | #251 | Tragic 55.4% |
| Aleuts | 0.6 /100 | #252 | Tragic 55.4% |
| Immigrants | Barbados | 0.6 /100 | #253 | Tragic 55.4% |
| Japanese | 0.5 /100 | #254 | Tragic 55.2% |
| Immigrants | Bahamas | 0.5 /100 | #255 | Tragic 55.2% |
| Immigrants | West Indies | 0.5 /100 | #256 | Tragic 55.2% |
| Indonesians | 0.4 /100 | #257 | Tragic 55.1% |
| Africans | 0.4 /100 | #258 | Tragic 55.0% |