Subsaharan African vs Brazilian Currently Married
COMPARE
Subsaharan African
Brazilian
Currently Married
Currently Married Comparison
Sub-Saharan Africans
Brazilians
42.6%
CURRENTLY MARRIED
0.0/ 100
METRIC RATING
292nd/ 347
METRIC RANK
46.4%
CURRENTLY MARRIED
39.3/ 100
METRIC RATING
184th/ 347
METRIC RANK
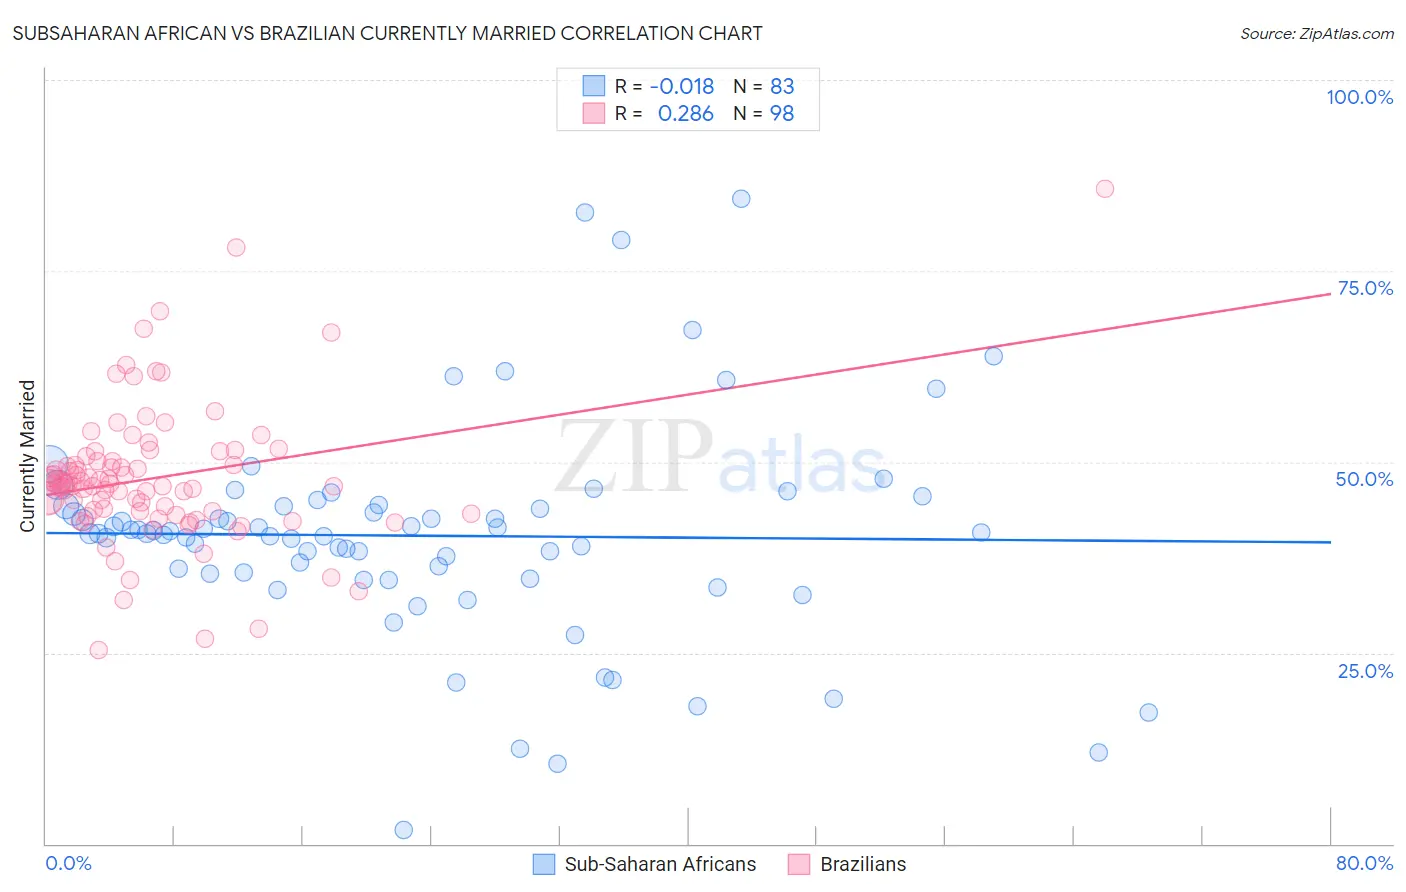
Subsaharan African vs Brazilian Currently Married Correlation Chart
The statistical analysis conducted on geographies consisting of 508,112,533 people shows no correlation between the proportion of Sub-Saharan Africans and percentage of population currently married in the United States with a correlation coefficient (R) of -0.018 and weighted average of 42.6%. Similarly, the statistical analysis conducted on geographies consisting of 323,904,544 people shows a weak positive correlation between the proportion of Brazilians and percentage of population currently married in the United States with a correlation coefficient (R) of 0.286 and weighted average of 46.4%, a difference of 9.1%.
Currently Married Correlation Summary
| Measurement | Subsaharan African | Brazilian |
| Minimum | 1.8% | 25.3% |
| Maximum | 84.5% | 85.7% |
| Range | 82.7% | 60.4% |
| Mean | 40.3% | 47.9% |
| Median | 40.7% | 47.2% |
| Interquartile 25% (IQ1) | 35.4% | 43.5% |
| Interquartile 75% (IQ3) | 44.3% | 50.1% |
| Interquartile Range (IQR) | 8.9% | 6.6% |
| Standard Deviation (Sample) | 14.0% | 9.1% |
| Standard Deviation (Population) | 13.9% | 9.1% |
Similar Demographics by Currently Married
Demographics Similar to Sub-Saharan Africans by Currently Married
In terms of currently married, the demographic groups most similar to Sub-Saharan Africans are Yuman (42.6%, a difference of 0.020%), Honduran (42.5%, a difference of 0.14%), Immigrants from Guatemala (42.6%, a difference of 0.16%), Immigrants from Ghana (42.7%, a difference of 0.27%), and Paiute (42.7%, a difference of 0.28%).
| Demographics | Rating | Rank | Currently Married |
| Immigrants | Middle Africa | 0.0 /100 | #285 | Tragic 43.0% |
| Ghanaians | 0.0 /100 | #286 | Tragic 42.9% |
| Guatemalans | 0.0 /100 | #287 | Tragic 42.9% |
| Natives/Alaskans | 0.0 /100 | #288 | Tragic 42.8% |
| Paiute | 0.0 /100 | #289 | Tragic 42.7% |
| Immigrants | Ghana | 0.0 /100 | #290 | Tragic 42.7% |
| Immigrants | Guatemala | 0.0 /100 | #291 | Tragic 42.6% |
| Sub-Saharan Africans | 0.0 /100 | #292 | Tragic 42.6% |
| Yuman | 0.0 /100 | #293 | Tragic 42.6% |
| Hondurans | 0.0 /100 | #294 | Tragic 42.5% |
| Immigrants | Western Africa | 0.0 /100 | #295 | Tragic 42.4% |
| Menominee | 0.0 /100 | #296 | Tragic 42.3% |
| Cheyenne | 0.0 /100 | #297 | Tragic 42.2% |
| Immigrants | Honduras | 0.0 /100 | #298 | Tragic 42.2% |
| Liberians | 0.0 /100 | #299 | Tragic 42.2% |
Demographics Similar to Brazilians by Currently Married
In terms of currently married, the demographic groups most similar to Brazilians are Immigrants from Northern Africa (46.5%, a difference of 0.020%), Mongolian (46.4%, a difference of 0.070%), Potawatomi (46.5%, a difference of 0.10%), Immigrants from Chile (46.4%, a difference of 0.10%), and Ottawa (46.5%, a difference of 0.14%).
| Demographics | Rating | Rank | Currently Married |
| Israelis | 48.6 /100 | #177 | Average 46.6% |
| Chickasaw | 47.8 /100 | #178 | Average 46.6% |
| Immigrants | Oceania | 44.6 /100 | #179 | Average 46.5% |
| Costa Ricans | 43.7 /100 | #180 | Average 46.5% |
| Ottawa | 43.0 /100 | #181 | Average 46.5% |
| Potawatomi | 41.9 /100 | #182 | Average 46.5% |
| Immigrants | Northern Africa | 39.7 /100 | #183 | Fair 46.5% |
| Brazilians | 39.3 /100 | #184 | Fair 46.4% |
| Mongolians | 37.6 /100 | #185 | Fair 46.4% |
| Immigrants | Chile | 36.8 /100 | #186 | Fair 46.4% |
| Immigrants | Peru | 35.3 /100 | #187 | Fair 46.4% |
| Colombians | 31.8 /100 | #188 | Fair 46.3% |
| Fijians | 30.3 /100 | #189 | Fair 46.3% |
| Choctaw | 29.1 /100 | #190 | Fair 46.3% |
| Immigrants | France | 27.7 /100 | #191 | Fair 46.2% |