Subsaharan African vs Belgian Householder Income Ages 25 - 44 years
COMPARE
Subsaharan African
Belgian
Householder Income Ages 25 - 44 years
Householder Income Ages 25 - 44 years Comparison
Sub-Saharan Africans
Belgians
$84,235
HOUSEHOLDER INCOME AGES 25 - 44 YEARS
0.3/ 100
METRIC RATING
268th/ 347
METRIC RANK
$94,262
HOUSEHOLDER INCOME AGES 25 - 44 YEARS
45.8/ 100
METRIC RATING
177th/ 347
METRIC RANK
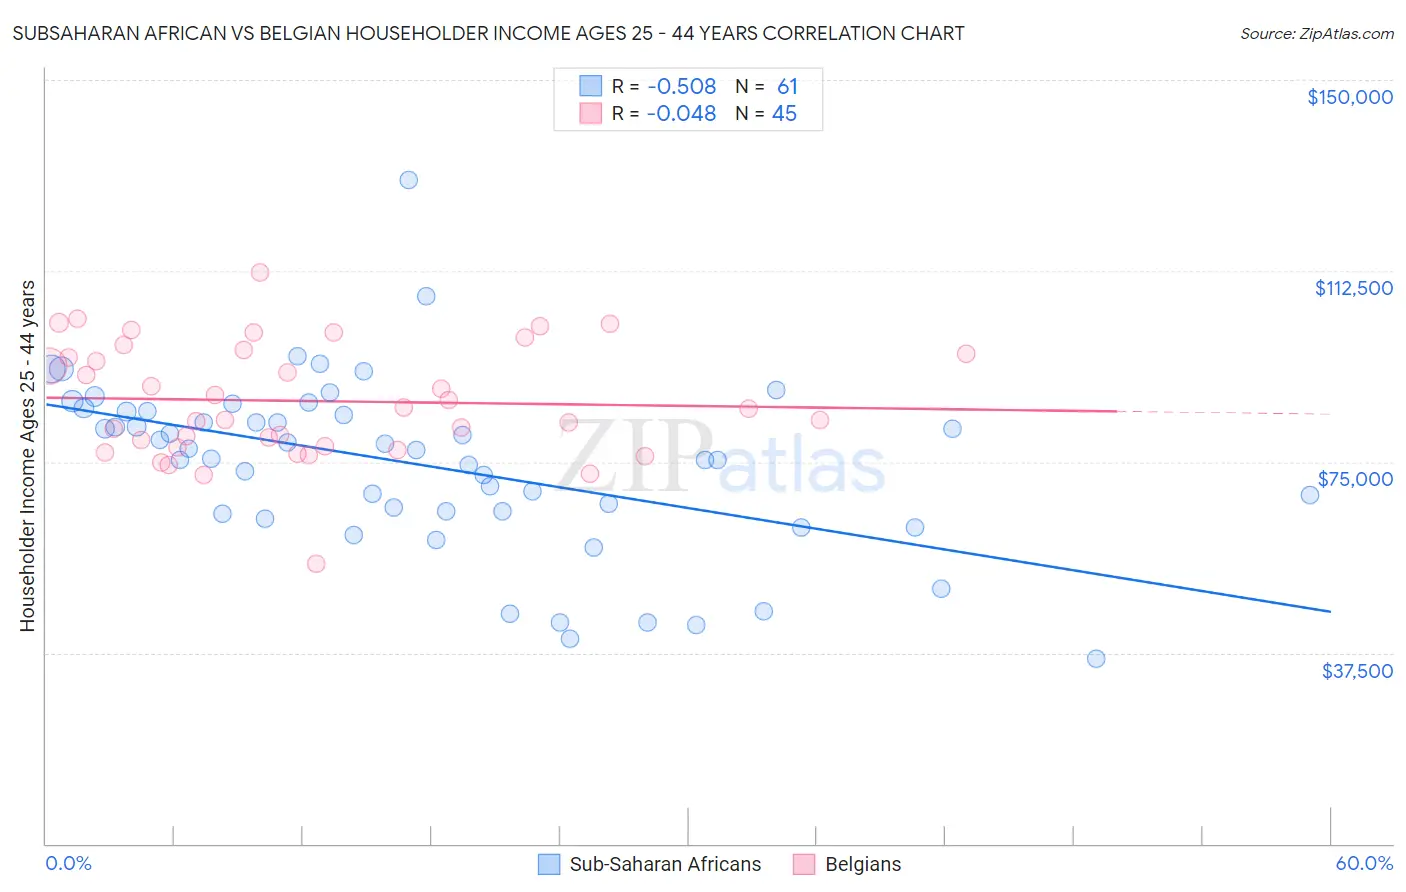
Subsaharan African vs Belgian Householder Income Ages 25 - 44 years Correlation Chart
The statistical analysis conducted on geographies consisting of 505,523,200 people shows a substantial negative correlation between the proportion of Sub-Saharan Africans and household income with householder between the ages 25 and 44 in the United States with a correlation coefficient (R) of -0.508 and weighted average of $84,235. Similarly, the statistical analysis conducted on geographies consisting of 354,979,371 people shows no correlation between the proportion of Belgians and household income with householder between the ages 25 and 44 in the United States with a correlation coefficient (R) of -0.048 and weighted average of $94,262, a difference of 11.9%.
Householder Income Ages 25 - 44 years Correlation Summary
| Measurement | Subsaharan African | Belgian |
| Minimum | $36,409 | $55,000 |
| Maximum | $130,453 | $112,283 |
| Range | $94,044 | $57,283 |
| Mean | $74,443 | $86,931 |
| Median | $77,380 | $85,500 |
| Interquartile 25% (IQ1) | $65,093 | $78,009 |
| Interquartile 75% (IQ3) | $84,848 | $96,571 |
| Interquartile Range (IQR) | $19,755 | $18,562 |
| Standard Deviation (Sample) | $17,109 | $11,310 |
| Standard Deviation (Population) | $16,968 | $11,183 |
Similar Demographics by Householder Income Ages 25 - 44 years
Demographics Similar to Sub-Saharan Africans by Householder Income Ages 25 - 44 years
In terms of householder income ages 25 - 44 years, the demographic groups most similar to Sub-Saharan Africans are Hmong ($84,258, a difference of 0.030%), Immigrants from Cabo Verde ($84,304, a difference of 0.080%), Spanish American Indian ($84,085, a difference of 0.18%), Sudanese ($84,401, a difference of 0.20%), and Osage ($84,461, a difference of 0.27%).
| Demographics | Rating | Rank | Householder Income Ages 25 - 44 years |
| Inupiat | 0.4 /100 | #261 | Tragic $84,619 |
| Cree | 0.4 /100 | #262 | Tragic $84,574 |
| Belizeans | 0.4 /100 | #263 | Tragic $84,534 |
| Osage | 0.4 /100 | #264 | Tragic $84,461 |
| Sudanese | 0.4 /100 | #265 | Tragic $84,401 |
| Immigrants | Cabo Verde | 0.3 /100 | #266 | Tragic $84,304 |
| Hmong | 0.3 /100 | #267 | Tragic $84,258 |
| Sub-Saharan Africans | 0.3 /100 | #268 | Tragic $84,235 |
| Spanish American Indians | 0.3 /100 | #269 | Tragic $84,085 |
| Jamaicans | 0.3 /100 | #270 | Tragic $83,933 |
| Somalis | 0.2 /100 | #271 | Tragic $83,752 |
| Spanish Americans | 0.2 /100 | #272 | Tragic $83,722 |
| Iroquois | 0.2 /100 | #273 | Tragic $83,682 |
| Marshallese | 0.2 /100 | #274 | Tragic $83,575 |
| Immigrants | Jamaica | 0.2 /100 | #275 | Tragic $83,298 |
Demographics Similar to Belgians by Householder Income Ages 25 - 44 years
In terms of householder income ages 25 - 44 years, the demographic groups most similar to Belgians are Immigrants ($94,423, a difference of 0.17%), English ($94,429, a difference of 0.18%), Immigrants from South America ($94,042, a difference of 0.23%), Colombian ($94,565, a difference of 0.32%), and Finnish ($94,610, a difference of 0.37%).
| Demographics | Rating | Rank | Householder Income Ages 25 - 44 years |
| Slovaks | 56.4 /100 | #170 | Average $95,032 |
| Immigrants | Armenia | 54.2 /100 | #171 | Average $94,867 |
| Scottish | 50.8 /100 | #172 | Average $94,622 |
| Finns | 50.6 /100 | #173 | Average $94,610 |
| Colombians | 50.0 /100 | #174 | Average $94,565 |
| English | 48.1 /100 | #175 | Average $94,429 |
| Immigrants | Immigrants | 48.0 /100 | #176 | Average $94,423 |
| Belgians | 45.8 /100 | #177 | Average $94,262 |
| Immigrants | South America | 42.8 /100 | #178 | Average $94,042 |
| French Canadians | 38.2 /100 | #179 | Fair $93,694 |
| French | 37.8 /100 | #180 | Fair $93,665 |
| Puget Sound Salish | 37.7 /100 | #181 | Fair $93,661 |
| Uruguayans | 37.3 /100 | #182 | Fair $93,631 |
| Guamanians/Chamorros | 36.5 /100 | #183 | Fair $93,569 |
| Germans | 36.0 /100 | #184 | Fair $93,531 |