Subsaharan African vs Belgian Family Households with Children
COMPARE
Subsaharan African
Belgian
Family Households with Children
Family Households with Children Comparison
Sub-Saharan Africans
Belgians
27.6%
FAMILY HOUSEHOLDS WITH CHILDREN
67.5/ 100
METRIC RATING
160th/ 347
METRIC RANK
26.9%
FAMILY HOUSEHOLDS WITH CHILDREN
2.1/ 100
METRIC RATING
250th/ 347
METRIC RANK
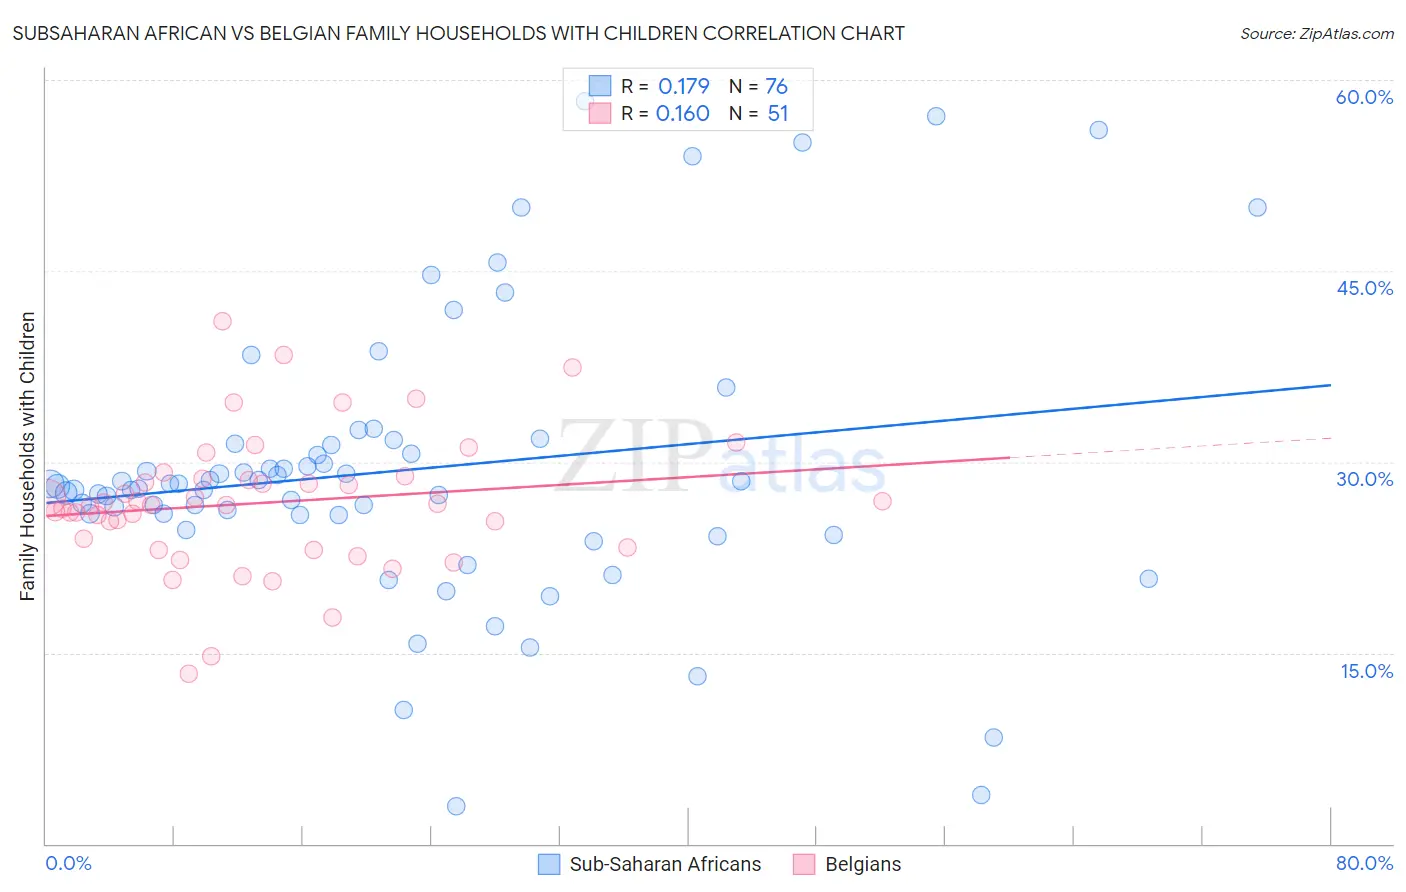
Subsaharan African vs Belgian Family Households with Children Correlation Chart
The statistical analysis conducted on geographies consisting of 507,337,784 people shows a poor positive correlation between the proportion of Sub-Saharan Africans and percentage of family households with children in the United States with a correlation coefficient (R) of 0.179 and weighted average of 27.6%. Similarly, the statistical analysis conducted on geographies consisting of 355,692,100 people shows a poor positive correlation between the proportion of Belgians and percentage of family households with children in the United States with a correlation coefficient (R) of 0.160 and weighted average of 26.9%, a difference of 2.6%.
Family Households with Children Correlation Summary
| Measurement | Subsaharan African | Belgian |
| Minimum | 3.0% | 13.4% |
| Maximum | 58.3% | 41.1% |
| Range | 55.4% | 27.7% |
| Mean | 29.4% | 26.8% |
| Median | 28.2% | 26.6% |
| Interquartile 25% (IQ1) | 25.8% | 23.3% |
| Interquartile 75% (IQ3) | 31.4% | 28.6% |
| Interquartile Range (IQR) | 5.6% | 5.4% |
| Standard Deviation (Sample) | 11.1% | 5.3% |
| Standard Deviation (Population) | 11.0% | 5.2% |
Similar Demographics by Family Households with Children
Demographics Similar to Sub-Saharan Africans by Family Households with Children
In terms of family households with children, the demographic groups most similar to Sub-Saharan Africans are Alaskan Athabascan (27.6%, a difference of 0.010%), Immigrants from Bangladesh (27.6%, a difference of 0.010%), Czech (27.5%, a difference of 0.050%), Immigrants from Hong Kong (27.5%, a difference of 0.060%), and Romanian (27.6%, a difference of 0.080%).
| Demographics | Rating | Rank | Family Households with Children |
| Immigrants | Cabo Verde | 75.6 /100 | #153 | Good 27.6% |
| Icelanders | 75.3 /100 | #154 | Good 27.6% |
| Comanche | 74.8 /100 | #155 | Good 27.6% |
| Hungarians | 74.6 /100 | #156 | Good 27.6% |
| Indians (Asian) | 71.6 /100 | #157 | Good 27.6% |
| Romanians | 70.8 /100 | #158 | Good 27.6% |
| Mongolians | 70.7 /100 | #159 | Good 27.6% |
| Sub-Saharan Africans | 67.5 /100 | #160 | Good 27.6% |
| Alaskan Athabascans | 67.1 /100 | #161 | Good 27.6% |
| Immigrants | Bangladesh | 67.0 /100 | #162 | Good 27.6% |
| Czechs | 65.3 /100 | #163 | Good 27.5% |
| Immigrants | Hong Kong | 64.9 /100 | #164 | Good 27.5% |
| Immigrants | South Africa | 61.3 /100 | #165 | Good 27.5% |
| Immigrants | Nonimmigrants | 61.2 /100 | #166 | Good 27.5% |
| Dominicans | 61.1 /100 | #167 | Good 27.5% |
Demographics Similar to Belgians by Family Households with Children
In terms of family households with children, the demographic groups most similar to Belgians are Immigrants from Eastern Europe (26.9%, a difference of 0.010%), Immigrants from Kazakhstan (26.9%, a difference of 0.020%), Potawatomi (26.9%, a difference of 0.030%), Immigrants from Bosnia and Herzegovina (26.8%, a difference of 0.060%), and Irish (26.8%, a difference of 0.090%).
| Demographics | Rating | Rank | Family Households with Children |
| Immigrants | Saudi Arabia | 2.9 /100 | #243 | Tragic 26.9% |
| Ukrainians | 2.9 /100 | #244 | Tragic 26.9% |
| Australians | 2.8 /100 | #245 | Tragic 26.9% |
| Jamaicans | 2.5 /100 | #246 | Tragic 26.9% |
| Potawatomi | 2.2 /100 | #247 | Tragic 26.9% |
| Immigrants | Kazakhstan | 2.2 /100 | #248 | Tragic 26.9% |
| Immigrants | Eastern Europe | 2.1 /100 | #249 | Tragic 26.9% |
| Belgians | 2.1 /100 | #250 | Tragic 26.9% |
| Immigrants | Bosnia and Herzegovina | 1.9 /100 | #251 | Tragic 26.8% |
| Irish | 1.8 /100 | #252 | Tragic 26.8% |
| Italians | 1.5 /100 | #253 | Tragic 26.8% |
| Immigrants | Scotland | 1.5 /100 | #254 | Tragic 26.8% |
| German Russians | 1.5 /100 | #255 | Tragic 26.8% |
| Scotch-Irish | 1.4 /100 | #256 | Tragic 26.8% |
| Slavs | 1.3 /100 | #257 | Tragic 26.8% |