Sri Lankan vs Guyanese Householder Income Over 65 years
COMPARE
Sri Lankan
Guyanese
Householder Income Over 65 years
Householder Income Over 65 years Comparison
Sri Lankans
Guyanese
$64,201
HOUSEHOLDER INCOME OVER 65 YEARS
96.7/ 100
METRIC RATING
97th/ 347
METRIC RANK
$56,351
HOUSEHOLDER INCOME OVER 65 YEARS
0.8/ 100
METRIC RATING
243rd/ 347
METRIC RANK
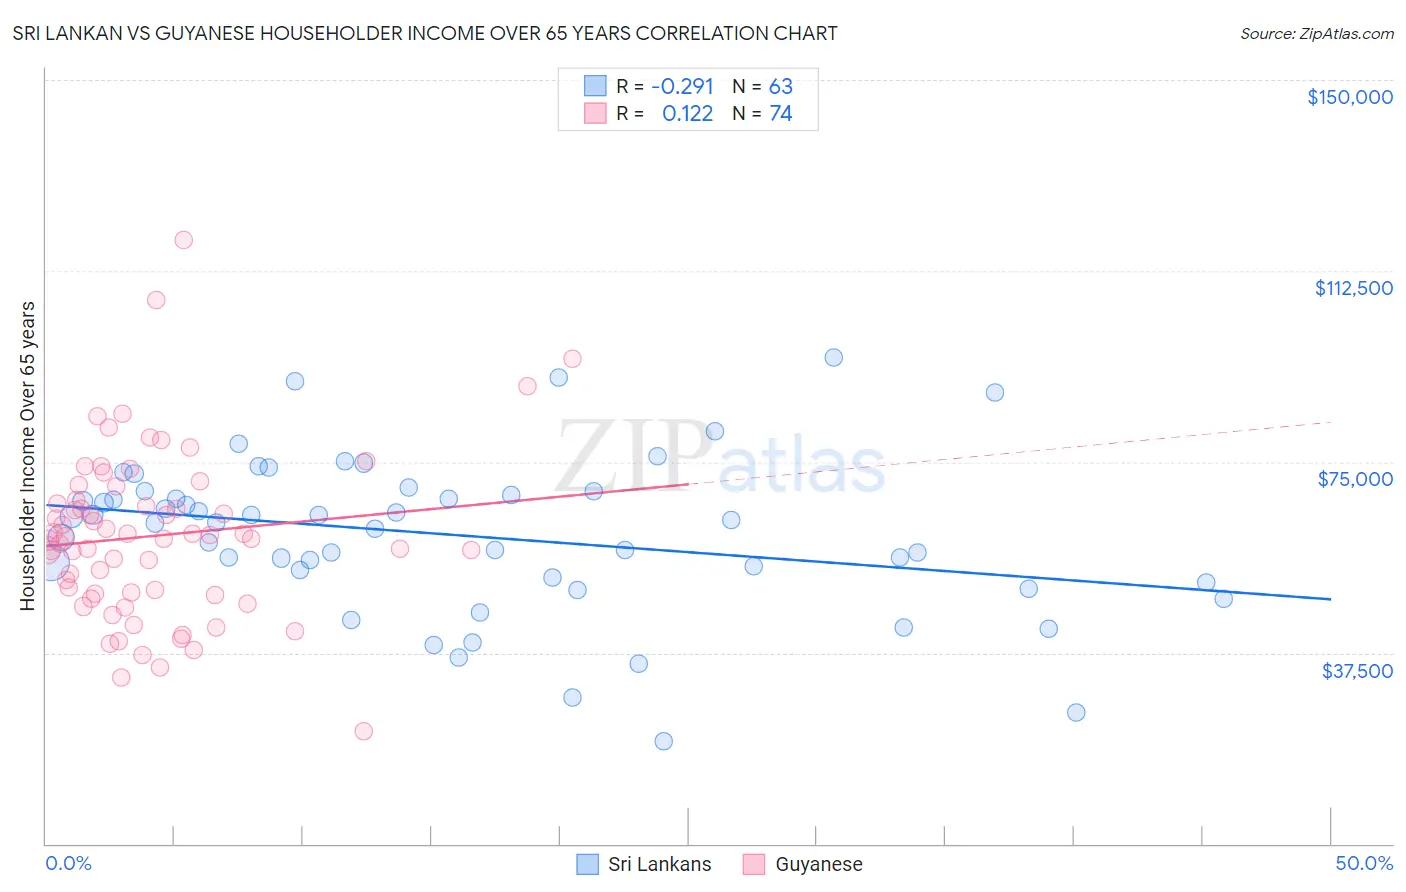
Sri Lankan vs Guyanese Householder Income Over 65 years Correlation Chart
The statistical analysis conducted on geographies consisting of 438,467,374 people shows a weak negative correlation between the proportion of Sri Lankans and household income with householder over the age of 65 in the United States with a correlation coefficient (R) of -0.291 and weighted average of $64,201. Similarly, the statistical analysis conducted on geographies consisting of 176,487,050 people shows a poor positive correlation between the proportion of Guyanese and household income with householder over the age of 65 in the United States with a correlation coefficient (R) of 0.122 and weighted average of $56,351, a difference of 13.9%.
Householder Income Over 65 years Correlation Summary
| Measurement | Sri Lankan | Guyanese |
| Minimum | $20,238 | $22,090 |
| Maximum | $95,504 | $118,508 |
| Range | $75,266 | $96,418 |
| Mean | $60,635 | $60,484 |
| Median | $63,086 | $60,185 |
| Interquartile 25% (IQ1) | $52,337 | $49,040 |
| Interquartile 75% (IQ3) | $69,167 | $67,479 |
| Interquartile Range (IQR) | $16,830 | $18,439 |
| Standard Deviation (Sample) | $15,340 | $16,619 |
| Standard Deviation (Population) | $15,218 | $16,506 |
Similar Demographics by Householder Income Over 65 years
Demographics Similar to Sri Lankans by Householder Income Over 65 years
In terms of householder income over 65 years, the demographic groups most similar to Sri Lankans are Romanian ($64,142, a difference of 0.090%), Immigrants from Hungary ($64,277, a difference of 0.12%), Assyrian/Chaldean/Syriac ($64,108, a difference of 0.14%), Immigrants from Egypt ($64,299, a difference of 0.15%), and Immigrants from Latvia ($64,298, a difference of 0.15%).
| Demographics | Rating | Rank | Householder Income Over 65 years |
| Immigrants | Kuwait | 97.4 /100 | #90 | Exceptional $64,433 |
| Immigrants | Oceania | 97.4 /100 | #91 | Exceptional $64,416 |
| Immigrants | Bulgaria | 97.3 /100 | #92 | Exceptional $64,379 |
| Jordanians | 97.1 /100 | #93 | Exceptional $64,313 |
| Immigrants | Egypt | 97.0 /100 | #94 | Exceptional $64,299 |
| Immigrants | Latvia | 97.0 /100 | #95 | Exceptional $64,298 |
| Immigrants | Hungary | 97.0 /100 | #96 | Exceptional $64,277 |
| Sri Lankans | 96.7 /100 | #97 | Exceptional $64,201 |
| Romanians | 96.5 /100 | #98 | Exceptional $64,142 |
| Assyrians/Chaldeans/Syriacs | 96.4 /100 | #99 | Exceptional $64,108 |
| Immigrants | South Eastern Asia | 96.3 /100 | #100 | Exceptional $64,089 |
| Immigrants | Italy | 96.2 /100 | #101 | Exceptional $64,065 |
| Chileans | 95.8 /100 | #102 | Exceptional $63,957 |
| British | 95.7 /100 | #103 | Exceptional $63,940 |
| Immigrants | Cameroon | 95.6 /100 | #104 | Exceptional $63,907 |
Demographics Similar to Guyanese by Householder Income Over 65 years
In terms of householder income over 65 years, the demographic groups most similar to Guyanese are Hmong ($56,339, a difference of 0.020%), Immigrants from Uzbekistan ($56,331, a difference of 0.040%), Central American ($56,321, a difference of 0.050%), Yaqui ($56,417, a difference of 0.12%), and Yakama ($56,234, a difference of 0.21%).
| Demographics | Rating | Rank | Householder Income Over 65 years |
| Immigrants | Uruguay | 1.5 /100 | #236 | Tragic $56,975 |
| Immigrants | Panama | 1.5 /100 | #237 | Tragic $56,944 |
| Fijians | 1.2 /100 | #238 | Tragic $56,768 |
| Immigrants | Laos | 1.2 /100 | #239 | Tragic $56,722 |
| Sub-Saharan Africans | 1.0 /100 | #240 | Tragic $56,615 |
| Immigrants | Guyana | 0.9 /100 | #241 | Tragic $56,495 |
| Yaqui | 0.8 /100 | #242 | Tragic $56,417 |
| Guyanese | 0.8 /100 | #243 | Tragic $56,351 |
| Hmong | 0.8 /100 | #244 | Tragic $56,339 |
| Immigrants | Uzbekistan | 0.8 /100 | #245 | Tragic $56,331 |
| Central Americans | 0.8 /100 | #246 | Tragic $56,321 |
| Yakama | 0.7 /100 | #247 | Tragic $56,234 |
| Vietnamese | 0.6 /100 | #248 | Tragic $56,143 |
| Mexican American Indians | 0.6 /100 | #249 | Tragic $56,089 |
| Immigrants | Bosnia and Herzegovina | 0.5 /100 | #250 | Tragic $55,986 |