Sri Lankan vs Immigrants from Uruguay Householder Income Over 65 years
COMPARE
Sri Lankan
Immigrants from Uruguay
Householder Income Over 65 years
Householder Income Over 65 years Comparison
Sri Lankans
Immigrants from Uruguay
$64,201
HOUSEHOLDER INCOME OVER 65 YEARS
96.7/ 100
METRIC RATING
97th/ 347
METRIC RANK
$56,975
HOUSEHOLDER INCOME OVER 65 YEARS
1.5/ 100
METRIC RATING
236th/ 347
METRIC RANK
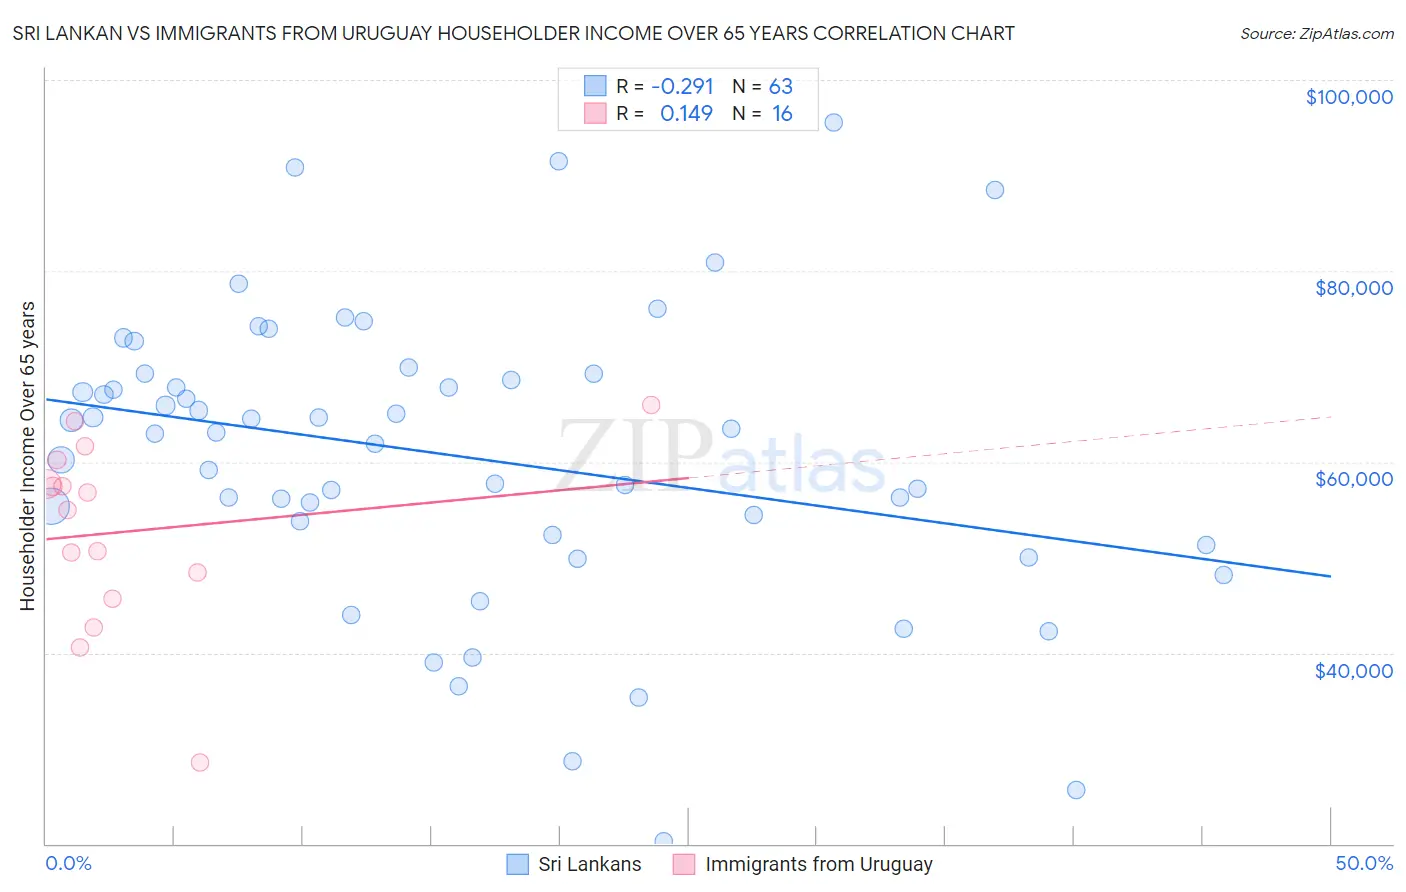
Sri Lankan vs Immigrants from Uruguay Householder Income Over 65 years Correlation Chart
The statistical analysis conducted on geographies consisting of 438,467,374 people shows a weak negative correlation between the proportion of Sri Lankans and household income with householder over the age of 65 in the United States with a correlation coefficient (R) of -0.291 and weighted average of $64,201. Similarly, the statistical analysis conducted on geographies consisting of 133,209,862 people shows a poor positive correlation between the proportion of Immigrants from Uruguay and household income with householder over the age of 65 in the United States with a correlation coefficient (R) of 0.149 and weighted average of $56,975, a difference of 12.7%.
Householder Income Over 65 years Correlation Summary
| Measurement | Sri Lankan | Immigrants from Uruguay |
| Minimum | $20,238 | $28,542 |
| Maximum | $95,504 | $65,972 |
| Range | $75,266 | $37,430 |
| Mean | $60,635 | $52,708 |
| Median | $63,086 | $55,916 |
| Interquartile 25% (IQ1) | $52,337 | $47,054 |
| Interquartile 75% (IQ3) | $69,167 | $58,928 |
| Interquartile Range (IQR) | $16,830 | $11,874 |
| Standard Deviation (Sample) | $15,340 | $9,823 |
| Standard Deviation (Population) | $15,218 | $9,511 |
Similar Demographics by Householder Income Over 65 years
Demographics Similar to Sri Lankans by Householder Income Over 65 years
In terms of householder income over 65 years, the demographic groups most similar to Sri Lankans are Romanian ($64,142, a difference of 0.090%), Immigrants from Hungary ($64,277, a difference of 0.12%), Assyrian/Chaldean/Syriac ($64,108, a difference of 0.14%), Immigrants from Egypt ($64,299, a difference of 0.15%), and Immigrants from Latvia ($64,298, a difference of 0.15%).
| Demographics | Rating | Rank | Householder Income Over 65 years |
| Immigrants | Kuwait | 97.4 /100 | #90 | Exceptional $64,433 |
| Immigrants | Oceania | 97.4 /100 | #91 | Exceptional $64,416 |
| Immigrants | Bulgaria | 97.3 /100 | #92 | Exceptional $64,379 |
| Jordanians | 97.1 /100 | #93 | Exceptional $64,313 |
| Immigrants | Egypt | 97.0 /100 | #94 | Exceptional $64,299 |
| Immigrants | Latvia | 97.0 /100 | #95 | Exceptional $64,298 |
| Immigrants | Hungary | 97.0 /100 | #96 | Exceptional $64,277 |
| Sri Lankans | 96.7 /100 | #97 | Exceptional $64,201 |
| Romanians | 96.5 /100 | #98 | Exceptional $64,142 |
| Assyrians/Chaldeans/Syriacs | 96.4 /100 | #99 | Exceptional $64,108 |
| Immigrants | South Eastern Asia | 96.3 /100 | #100 | Exceptional $64,089 |
| Immigrants | Italy | 96.2 /100 | #101 | Exceptional $64,065 |
| Chileans | 95.8 /100 | #102 | Exceptional $63,957 |
| British | 95.7 /100 | #103 | Exceptional $63,940 |
| Immigrants | Cameroon | 95.6 /100 | #104 | Exceptional $63,907 |
Demographics Similar to Immigrants from Uruguay by Householder Income Over 65 years
In terms of householder income over 65 years, the demographic groups most similar to Immigrants from Uruguay are Immigrants from Panama ($56,944, a difference of 0.050%), Spanish American ($57,021, a difference of 0.080%), Immigrants from Burma/Myanmar ($57,114, a difference of 0.24%), Immigrants from Western Africa ($57,119, a difference of 0.25%), and Fijian ($56,768, a difference of 0.36%).
| Demographics | Rating | Rank | Householder Income Over 65 years |
| Immigrants | Colombia | 3.0 /100 | #229 | Tragic $57,658 |
| Immigrants | Cambodia | 2.8 /100 | #230 | Tragic $57,580 |
| Immigrants | Nonimmigrants | 2.4 /100 | #231 | Tragic $57,426 |
| Immigrants | Venezuela | 2.3 /100 | #232 | Tragic $57,371 |
| Immigrants | Western Africa | 1.7 /100 | #233 | Tragic $57,119 |
| Immigrants | Burma/Myanmar | 1.7 /100 | #234 | Tragic $57,114 |
| Spanish Americans | 1.6 /100 | #235 | Tragic $57,021 |
| Immigrants | Uruguay | 1.5 /100 | #236 | Tragic $56,975 |
| Immigrants | Panama | 1.5 /100 | #237 | Tragic $56,944 |
| Fijians | 1.2 /100 | #238 | Tragic $56,768 |
| Immigrants | Laos | 1.2 /100 | #239 | Tragic $56,722 |
| Sub-Saharan Africans | 1.0 /100 | #240 | Tragic $56,615 |
| Immigrants | Guyana | 0.9 /100 | #241 | Tragic $56,495 |
| Yaqui | 0.8 /100 | #242 | Tragic $56,417 |
| Guyanese | 0.8 /100 | #243 | Tragic $56,351 |