Sri Lankan vs Irish Householder Income Over 65 years
COMPARE
Sri Lankan
Irish
Householder Income Over 65 years
Householder Income Over 65 years Comparison
Sri Lankans
Irish
$64,201
HOUSEHOLDER INCOME OVER 65 YEARS
96.7/ 100
METRIC RATING
97th/ 347
METRIC RANK
$61,097
HOUSEHOLDER INCOME OVER 65 YEARS
53.4/ 100
METRIC RATING
168th/ 347
METRIC RANK
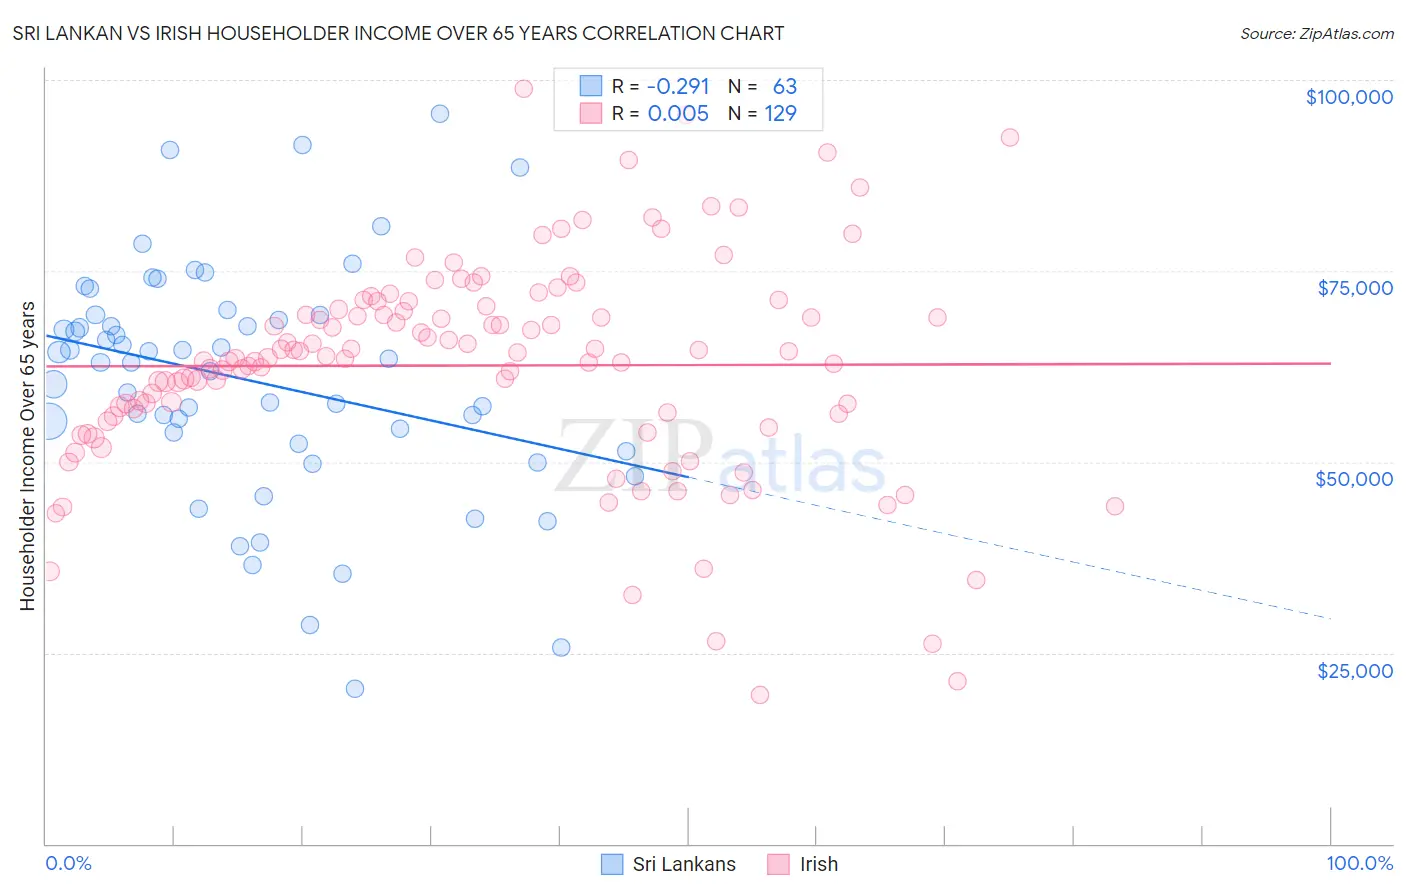
Sri Lankan vs Irish Householder Income Over 65 years Correlation Chart
The statistical analysis conducted on geographies consisting of 438,467,374 people shows a weak negative correlation between the proportion of Sri Lankans and household income with householder over the age of 65 in the United States with a correlation coefficient (R) of -0.291 and weighted average of $64,201. Similarly, the statistical analysis conducted on geographies consisting of 573,728,023 people shows no correlation between the proportion of Irish and household income with householder over the age of 65 in the United States with a correlation coefficient (R) of 0.005 and weighted average of $61,097, a difference of 5.1%.
Householder Income Over 65 years Correlation Summary
| Measurement | Sri Lankan | Irish |
| Minimum | $20,238 | $19,395 |
| Maximum | $95,504 | $98,930 |
| Range | $75,266 | $79,535 |
| Mean | $60,635 | $62,615 |
| Median | $63,086 | $63,596 |
| Interquartile 25% (IQ1) | $52,337 | $56,098 |
| Interquartile 75% (IQ3) | $69,167 | $70,177 |
| Interquartile Range (IQR) | $16,830 | $14,079 |
| Standard Deviation (Sample) | $15,340 | $14,074 |
| Standard Deviation (Population) | $15,218 | $14,019 |
Similar Demographics by Householder Income Over 65 years
Demographics Similar to Sri Lankans by Householder Income Over 65 years
In terms of householder income over 65 years, the demographic groups most similar to Sri Lankans are Romanian ($64,142, a difference of 0.090%), Immigrants from Hungary ($64,277, a difference of 0.12%), Assyrian/Chaldean/Syriac ($64,108, a difference of 0.14%), Immigrants from Egypt ($64,299, a difference of 0.15%), and Immigrants from Latvia ($64,298, a difference of 0.15%).
| Demographics | Rating | Rank | Householder Income Over 65 years |
| Immigrants | Kuwait | 97.4 /100 | #90 | Exceptional $64,433 |
| Immigrants | Oceania | 97.4 /100 | #91 | Exceptional $64,416 |
| Immigrants | Bulgaria | 97.3 /100 | #92 | Exceptional $64,379 |
| Jordanians | 97.1 /100 | #93 | Exceptional $64,313 |
| Immigrants | Egypt | 97.0 /100 | #94 | Exceptional $64,299 |
| Immigrants | Latvia | 97.0 /100 | #95 | Exceptional $64,298 |
| Immigrants | Hungary | 97.0 /100 | #96 | Exceptional $64,277 |
| Sri Lankans | 96.7 /100 | #97 | Exceptional $64,201 |
| Romanians | 96.5 /100 | #98 | Exceptional $64,142 |
| Assyrians/Chaldeans/Syriacs | 96.4 /100 | #99 | Exceptional $64,108 |
| Immigrants | South Eastern Asia | 96.3 /100 | #100 | Exceptional $64,089 |
| Immigrants | Italy | 96.2 /100 | #101 | Exceptional $64,065 |
| Chileans | 95.8 /100 | #102 | Exceptional $63,957 |
| British | 95.7 /100 | #103 | Exceptional $63,940 |
| Immigrants | Cameroon | 95.6 /100 | #104 | Exceptional $63,907 |
Demographics Similar to Irish by Householder Income Over 65 years
In terms of householder income over 65 years, the demographic groups most similar to Irish are Norwegian ($61,104, a difference of 0.010%), Carpatho Rusyn ($61,093, a difference of 0.010%), Serbian ($61,087, a difference of 0.020%), Inupiat ($61,061, a difference of 0.060%), and Immigrants from Poland ($61,041, a difference of 0.090%).
| Demographics | Rating | Rank | Householder Income Over 65 years |
| Icelanders | 57.9 /100 | #161 | Average $61,270 |
| Czechs | 57.2 /100 | #162 | Average $61,244 |
| Ugandans | 55.5 /100 | #163 | Average $61,177 |
| Immigrants | North Macedonia | 55.4 /100 | #164 | Average $61,175 |
| Immigrants | Ukraine | 55.1 /100 | #165 | Average $61,163 |
| Immigrants | Eastern Africa | 55.0 /100 | #166 | Average $61,157 |
| Norwegians | 53.6 /100 | #167 | Average $61,104 |
| Irish | 53.4 /100 | #168 | Average $61,097 |
| Carpatho Rusyns | 53.3 /100 | #169 | Average $61,093 |
| Serbians | 53.1 /100 | #170 | Average $61,087 |
| Inupiat | 52.4 /100 | #171 | Average $61,061 |
| Immigrants | Poland | 51.9 /100 | #172 | Average $61,041 |
| Immigrants | Micronesia | 50.8 /100 | #173 | Average $61,000 |
| Luxembourgers | 50.0 /100 | #174 | Average $60,967 |
| Spaniards | 47.3 /100 | #175 | Average $60,866 |