Sri Lankan vs Houma Householder Income Over 65 years

COMPARE

Sri Lankan
Race
Ancestry
AfghanAfricanAlaska NativeAlaskan AthabascanAlbanianAleutAlsatianAmericanApacheArabArapahoArgentineanArmenianAssyrian/Chaldean/SyriacAustralianAustrianBahamianBangladeshiBarbadianBasqueBelgianBelizeanBermudanBhutaneseBlackfeetBolivianBrazilianBritishBritish West IndianBulgarianBurmeseCajunCambodianCanadianCape VerdeanCarpatho RusynCelticCentral AmericanCentral American IndianCherokeeCheyenneChickasawChileanChineseChippewaChoctawColombianColvilleComancheCosta RicanCreeCreekCroatianCrowCubanCypriotCzechCzechoslovakianDanishDelawareDominicanDutchDutch West IndianEastern EuropeanEcuadorianEgyptianEnglishEstonianEthiopianEuropeanFijianFilipinoFinnishFrenchFrench American IndianFrench CanadianGermanGerman RussianGhanaianGreekGuamanian/ChamorroGuatemalanGuyaneseHaitianHmongHonduranHopiHungarianIcelanderIndian (Asian)IndonesianInupiatIranianIraqiIrishIroquoisIsraeliItalianJamaicanJapaneseJordanianKenyanKiowaKoreanLaotianLatvianLebaneseLiberianLithuanianLumbeeLuxembourgerMacedonianMalaysianMalteseMarshalleseMenomineeMexicanMexican American IndianMongolianMoroccanNative HawaiianNavajoNepaleseNew ZealanderNicaraguanNigerianNorthern EuropeanNorwegianOkinawanOsageOttawaPaiutePakistaniPalestinianPanamanianParaguayanPennsylvania GermanPeruvianPimaPolishPortuguesePotawatomiPuebloPuerto RicanPuget Sound SalishRomanianRussianSalvadoranSamoanScandinavianScotch-IrishScottishSeminoleSenegaleseSerbianShoshoneSierra LeoneanSiouxSlavicSlovakSloveneSomaliSouth AfricanSouth AmericanSouth American IndianSoviet UnionSpaniardSpanishSpanish AmericanSpanish American IndianSri LankanSubsaharan AfricanSudaneseSwedishSwissSyrianTaiwaneseThaiTlingit-HaidaTohono O'OdhamTonganTrinidadian and TobagonianTsimshianTurkishU.S. Virgin IslanderUgandanUkrainianUruguayanUteVenezuelanVietnameseWelshWest IndianYakamaYaquiYugoslavianYumanYup'ikZimbabwean
Immigration
NonimmigrantsImmigrantsAfghanistanAfricaAlbaniaArgentinaArmeniaAsiaAustraliaAustriaBahamasBangladeshBarbadosBelarusBelgiumBelizeBoliviaBosnia and HerzegovinaBrazilBulgariaBurma/MyanmarCabo VerdeCambodiaCameroonCanadaCaribbeanCentral AmericaChileChinaColombiaCongoCosta RicaCroatiaCubaCzechoslovakiaDenmarkDominicaDominican RepublicEastern AfricaEastern AsiaEastern EuropeEcuadorEgyptEl SalvadorEnglandEritreaEthiopiaEuropeFijiFranceGermanyGhanaGreeceGrenadaGuatemalaGuyanaHaitiHondurasHong KongHungaryIndiaIndonesiaIranIraqIrelandIsraelItalyJamaicaJapanJordanKazakhstanKenyaKoreaKuwaitLaosLatin AmericaLatviaLebanonLiberiaLithuaniaMalaysiaMexicoMicronesiaMiddle AfricaMoldovaMoroccoNepalNetherlandsNicaraguaNigeriaNorth AmericaNorth MacedoniaNorthern AfricaNorthern EuropeNorwayOceaniaPakistanPanamaPeruPhilippinesPolandPortugalRomaniaRussiaSaudi ArabiaScotlandSenegalSerbiaSierra LeoneSingaporeSomaliaSouth AfricaSouth AmericaSouth Central AsiaSouth Eastern AsiaSouthern EuropeSpainSri LankaSt. Vincent and the GrenadinesSudanSwedenSwitzerlandSyriaTaiwanThailandTrinidad and TobagoTurkeyUgandaUkraineUruguayUzbekistanVenezuelaVietnamWest IndiesWestern AfricaWestern AsiaWestern EuropeYemenZaireZimbabweAzores
Houma
Race
Ancestry
AfghanAfricanAlaska NativeAlaskan AthabascanAlbanianAleutAlsatianAmericanApacheArabArapahoArgentineanArmenianAssyrian/Chaldean/SyriacAustralianAustrianBahamianBangladeshiBarbadianBasqueBelgianBelizeanBermudanBhutaneseBlackfeetBolivianBrazilianBritishBritish West IndianBulgarianBurmeseCajunCambodianCanadianCape VerdeanCarpatho RusynCelticCentral AmericanCentral American IndianCherokeeCheyenneChickasawChileanChineseChippewaChoctawColombianColvilleComancheCosta RicanCreeCreekCroatianCrowCubanCypriotCzechCzechoslovakianDanishDelawareDominicanDutchDutch West IndianEastern EuropeanEcuadorianEgyptianEnglishEstonianEthiopianEuropeanFijianFilipinoFinnishFrenchFrench American IndianFrench CanadianGermanGerman RussianGhanaianGreekGuamanian/ChamorroGuatemalanGuyaneseHaitianHmongHonduranHopiHoumaHungarianIcelanderIndian (Asian)IndonesianInupiatIranianIraqiIrishIroquoisIsraeliItalianJamaicanJapaneseJordanianKenyanKiowaKoreanLaotianLatvianLebaneseLiberianLithuanianLumbeeLuxembourgerMacedonianMalaysianMalteseMarshalleseMenomineeMexicanMexican American IndianMongolianMoroccanNative HawaiianNavajoNepaleseNew ZealanderNicaraguanNigerianNorthern EuropeanNorwegianOkinawanOsageOttawaPaiutePakistaniPalestinianPanamanianParaguayanPennsylvania GermanPeruvianPimaPolishPortuguesePotawatomiPuebloPuerto RicanPuget Sound SalishRomanianRussianSalvadoranSamoanScandinavianScotch-IrishScottishSeminoleSenegaleseSerbianShoshoneSierra LeoneanSiouxSlavicSlovakSloveneSomaliSouth AfricanSouth AmericanSouth American IndianSoviet UnionSpaniardSpanishSpanish AmericanSpanish American IndianSubsaharan AfricanSudaneseSwedishSwissSyrianTaiwaneseThaiTlingit-HaidaTohono O'OdhamTonganTrinidadian and TobagonianTsimshianTurkishU.S. Virgin IslanderUgandanUkrainianUruguayanUteVenezuelanVietnameseWelshWest IndianYakamaYaquiYugoslavianYumanYup'ikZimbabwean
Immigration
NonimmigrantsImmigrantsAfghanistanAfricaAlbaniaArgentinaArmeniaAsiaAustraliaAustriaBahamasBangladeshBarbadosBelarusBelgiumBelizeBoliviaBosnia and HerzegovinaBrazilBulgariaBurma/MyanmarCabo VerdeCambodiaCameroonCanadaCaribbeanCentral AmericaChileChinaColombiaCongoCosta RicaCroatiaCubaCzechoslovakiaDenmarkDominicaDominican RepublicEastern AfricaEastern AsiaEastern EuropeEcuadorEgyptEl SalvadorEnglandEritreaEthiopiaEuropeFijiFranceGermanyGhanaGreeceGrenadaGuatemalaGuyanaHaitiHondurasHong KongHungaryIndiaIndonesiaIranIraqIrelandIsraelItalyJamaicaJapanJordanKazakhstanKenyaKoreaKuwaitLaosLatin AmericaLatviaLebanonLiberiaLithuaniaMalaysiaMexicoMicronesiaMiddle AfricaMoldovaMoroccoNepalNetherlandsNicaraguaNigeriaNorth AmericaNorth MacedoniaNorthern AfricaNorthern EuropeNorwayOceaniaPakistanPanamaPeruPhilippinesPolandPortugalRomaniaRussiaSaudi ArabiaScotlandSenegalSerbiaSierra LeoneSingaporeSomaliaSouth AfricaSouth AmericaSouth Central AsiaSouth Eastern AsiaSouthern EuropeSpainSri LankaSt. Vincent and the GrenadinesSudanSwedenSwitzerlandSyriaTaiwanThailandTrinidad and TobagoTurkeyUgandaUkraineUruguayUzbekistanVenezuelaVietnamWest IndiesWestern AfricaWestern AsiaWestern EuropeYemenZaireZimbabweAzores
Householder Income Over 65 years
Income
Poverty
Unemployment
Labor Participation
Family Structure
Vehicle Availability
Education Level
Disability

Householder Income Over 65 years Comparison

Sri Lankans

Houma

Exceptional
Tragic
$64,201
HOUSEHOLDER INCOME OVER 65 YEARS
96.7/ 100
METRIC RATING
97th/ 347
METRIC RANK
$44,822
HOUSEHOLDER INCOME OVER 65 YEARS
0.0/ 100
METRIC RATING
344th/ 347
METRIC RANK

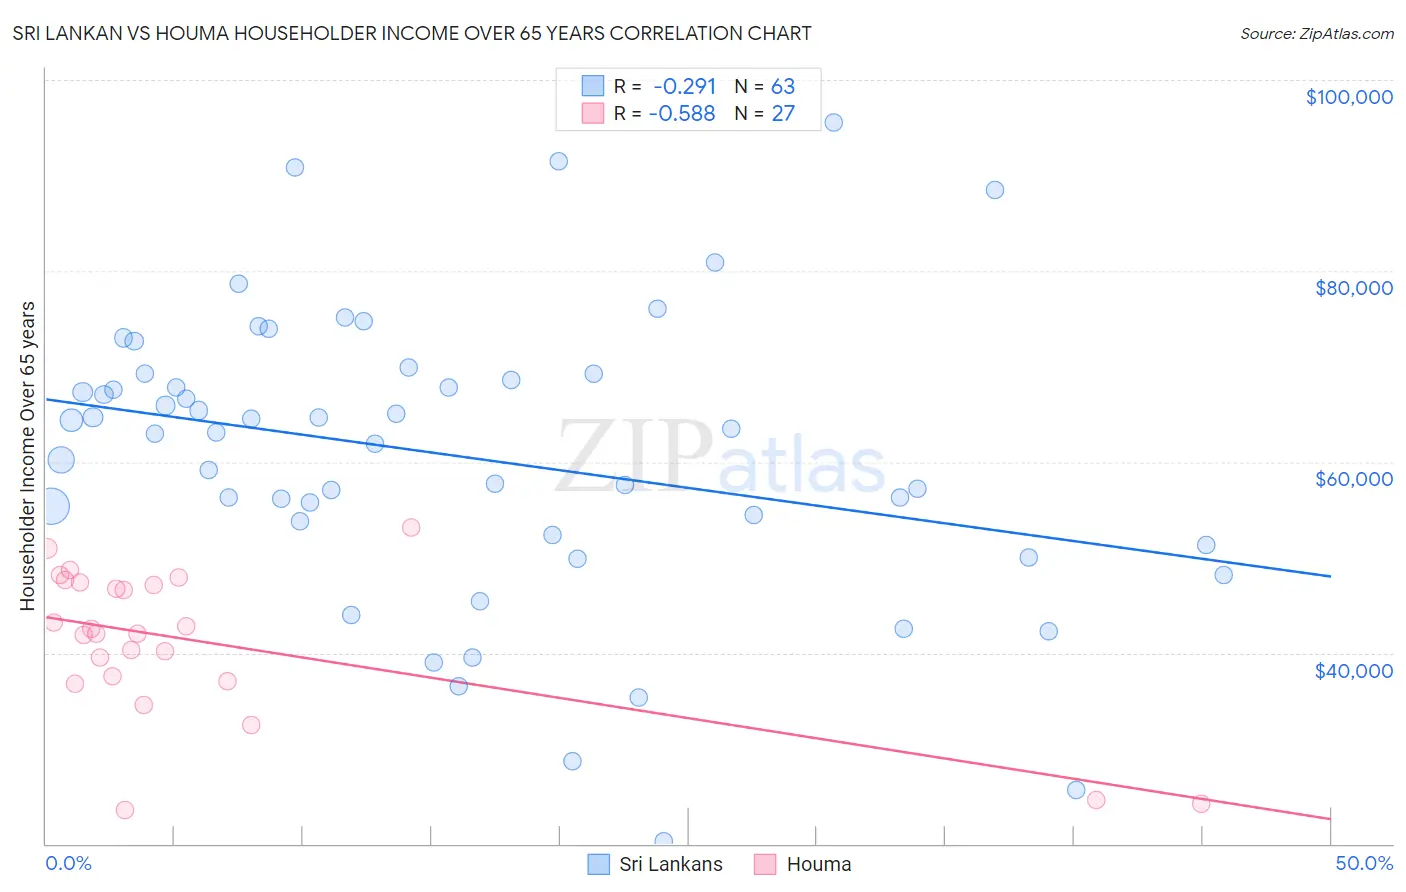
Sri Lankan vs Houma Householder Income Over 65 years Correlation Chart

The statistical analysis conducted on geographies consisting of 438,467,374 people shows a weak negative correlation between the proportion of Sri Lankans and household income with householder over the age of 65 in the United States with a correlation coefficient (R) of -0.291 and weighted average of $64,201. Similarly, the statistical analysis conducted on geographies consisting of 36,737,903 people shows a substantial negative correlation between the proportion of Houma and household income with householder over the age of 65 in the United States with a correlation coefficient (R) of -0.588 and weighted average of $44,822, a difference of 43.2%.
Sri Lankan vs Houma Householder Income Over 65 years

Householder Income Over 65 years Correlation Summary

MeasurementSri LankanHouma
Minimum$20,238$23,495
Maximum$95,504$53,137
Range$75,266$29,642
Mean$60,635$41,091
Median$63,086$42,014
Interquartile 25% (IQ1)$52,337$37,039
Interquartile 75% (IQ3)$69,167$47,429
Interquartile Range (IQR)$16,830$10,390
Standard Deviation (Sample)$15,340$7,902
Standard Deviation (Population)$15,218$7,754

Similar Demographics by Householder Income Over 65 years

Demographics Similar to Sri Lankans by Householder Income Over 65 years

In terms of householder income over 65 years, the demographic groups most similar to Sri Lankans are Romanian ($64,142, a difference of 0.090%), Immigrants from Hungary ($64,277, a difference of 0.12%), Assyrian/Chaldean/Syriac ($64,108, a difference of 0.14%), Immigrants from Egypt ($64,299, a difference of 0.15%), and Immigrants from Latvia ($64,298, a difference of 0.15%).
DemographicsRating | RankHouseholder Income Over 65 years
Immigrants | Kuwait
97.4
/100
|
#90
Exceptional
$64,433
Immigrants | Oceania
97.4
/100
|
#91
Exceptional
$64,416
Immigrants | Bulgaria
97.3
/100
|
#92
Exceptional
$64,379
Jordanians
97.1
/100
|
#93
Exceptional
$64,313
Immigrants | Egypt
97.0
/100
|
#94
Exceptional
$64,299
Immigrants | Latvia
97.0
/100
|
#95
Exceptional
$64,298
Immigrants | Hungary
97.0
/100
|
#96
Exceptional
$64,277
Sri Lankans
96.7
/100
|
#97
Exceptional
$64,201
Romanians
96.5
/100
|
#98
Exceptional
$64,142
Assyrians/Chaldeans/Syriacs
96.4
/100
|
#99
Exceptional
$64,108
Immigrants | South Eastern Asia
96.3
/100
|
#100
Exceptional
$64,089
Immigrants | Italy
96.2
/100
|
#101
Exceptional
$64,065
Chileans
95.8
/100
|
#102
Exceptional
$63,957
British
95.7
/100
|
#103
Exceptional
$63,940
Immigrants | Cameroon
95.6
/100
|
#104
Exceptional
$63,907

Demographics Similar to Houma by Householder Income Over 65 years

In terms of householder income over 65 years, the demographic groups most similar to Houma are Immigrants from Cuba ($44,735, a difference of 0.19%), Immigrants from Dominican Republic ($45,758, a difference of 2.1%), Immigrants from Cabo Verde ($46,654, a difference of 4.1%), Dominican ($46,964, a difference of 4.8%), and Puerto Rican ($42,550, a difference of 5.3%).
DemographicsRating | RankHouseholder Income Over 65 years
Cape Verdeans
0.0
/100
|
#333
Tragic
$50,077
Immigrants | Dominica
0.0
/100
|
#334
Tragic
$50,071
Crow
0.0
/100
|
#335
Tragic
$49,234
Cubans
0.0
/100
|
#336
Tragic
$49,152
Tohono O'odham
0.0
/100
|
#337
Tragic
$49,121
Immigrants | Caribbean
0.0
/100
|
#338
Tragic
$48,535
Navajo
0.0
/100
|
#339
Tragic
$47,722
Immigrants | Yemen
0.0
/100
|
#340
Tragic
$47,527
Dominicans
0.0
/100
|
#341
Tragic
$46,964
Immigrants | Cabo Verde
0.0
/100
|
#342
Tragic
$46,654
Immigrants | Dominican Republic
0.0
/100
|
#343
Tragic
$45,758
Houma
0.0
/100
|
#344
Tragic
$44,822
Immigrants | Cuba
0.0
/100
|
#345
Tragic
$44,735
Puerto Ricans
0.0
/100
|
#346
Tragic
$42,550
Lumbee
0.0
/100
|
#347
Tragic
$40,550