Sri Lankan vs Immigrants from Croatia Householder Income Over 65 years
COMPARE
Sri Lankan
Immigrants from Croatia
Householder Income Over 65 years
Householder Income Over 65 years Comparison
Sri Lankans
Immigrants from Croatia
$64,201
HOUSEHOLDER INCOME OVER 65 YEARS
96.7/ 100
METRIC RATING
97th/ 347
METRIC RANK
$63,168
HOUSEHOLDER INCOME OVER 65 YEARS
90.9/ 100
METRIC RATING
117th/ 347
METRIC RANK
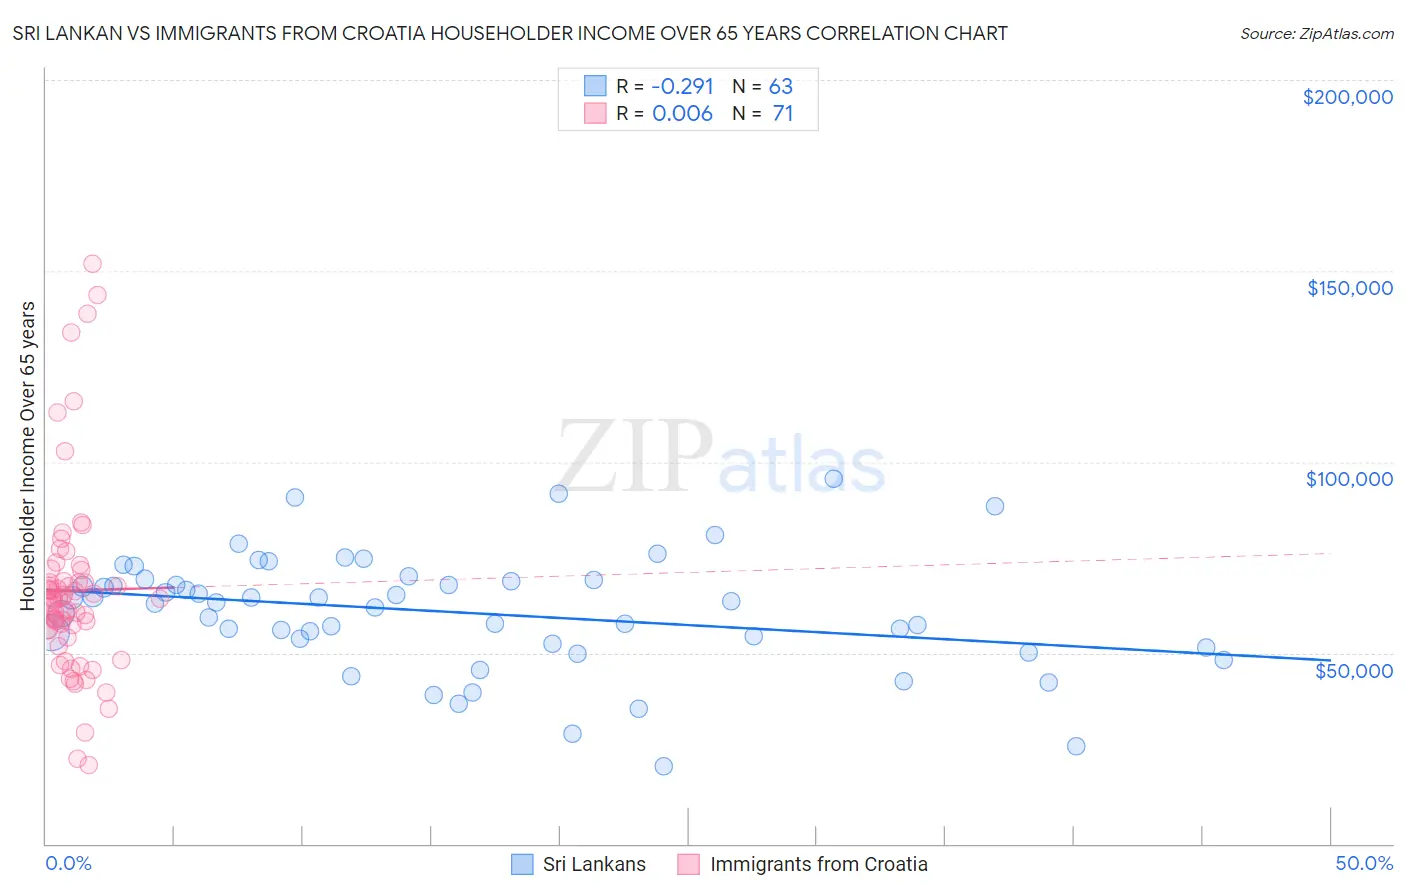
Sri Lankan vs Immigrants from Croatia Householder Income Over 65 years Correlation Chart
The statistical analysis conducted on geographies consisting of 438,467,374 people shows a weak negative correlation between the proportion of Sri Lankans and household income with householder over the age of 65 in the United States with a correlation coefficient (R) of -0.291 and weighted average of $64,201. Similarly, the statistical analysis conducted on geographies consisting of 132,518,281 people shows no correlation between the proportion of Immigrants from Croatia and household income with householder over the age of 65 in the United States with a correlation coefficient (R) of 0.006 and weighted average of $63,168, a difference of 1.6%.
Householder Income Over 65 years Correlation Summary
| Measurement | Sri Lankan | Immigrants from Croatia |
| Minimum | $20,238 | $20,764 |
| Maximum | $95,504 | $151,983 |
| Range | $75,266 | $131,219 |
| Mean | $60,635 | $66,306 |
| Median | $63,086 | $64,003 |
| Interquartile 25% (IQ1) | $52,337 | $56,104 |
| Interquartile 75% (IQ3) | $69,167 | $68,616 |
| Interquartile Range (IQR) | $16,830 | $12,512 |
| Standard Deviation (Sample) | $15,340 | $24,936 |
| Standard Deviation (Population) | $15,218 | $24,760 |
Demographics Similar to Sri Lankans and Immigrants from Croatia by Householder Income Over 65 years
In terms of householder income over 65 years, the demographic groups most similar to Sri Lankans are Romanian ($64,142, a difference of 0.090%), Assyrian/Chaldean/Syriac ($64,108, a difference of 0.14%), Immigrants from South Eastern Asia ($64,089, a difference of 0.17%), Immigrants from Italy ($64,065, a difference of 0.21%), and Chilean ($63,957, a difference of 0.38%). Similarly, the demographic groups most similar to Immigrants from Croatia are Guamanian/Chamorro ($63,187, a difference of 0.030%), Croatian ($63,225, a difference of 0.090%), Immigrants from Saudi Arabia ($63,355, a difference of 0.30%), Immigrants from Serbia ($63,387, a difference of 0.35%), and Syrian ($63,494, a difference of 0.52%).
| Demographics | Rating | Rank | Householder Income Over 65 years |
| Sri Lankans | 96.7 /100 | #97 | Exceptional $64,201 |
| Romanians | 96.5 /100 | #98 | Exceptional $64,142 |
| Assyrians/Chaldeans/Syriacs | 96.4 /100 | #99 | Exceptional $64,108 |
| Immigrants | South Eastern Asia | 96.3 /100 | #100 | Exceptional $64,089 |
| Immigrants | Italy | 96.2 /100 | #101 | Exceptional $64,065 |
| Chileans | 95.8 /100 | #102 | Exceptional $63,957 |
| British | 95.7 /100 | #103 | Exceptional $63,940 |
| Immigrants | Cameroon | 95.6 /100 | #104 | Exceptional $63,907 |
| Italians | 95.5 /100 | #105 | Exceptional $63,885 |
| Immigrants | Argentina | 95.5 /100 | #106 | Exceptional $63,885 |
| Pakistanis | 95.3 /100 | #107 | Exceptional $63,844 |
| Palestinians | 95.1 /100 | #108 | Exceptional $63,800 |
| Europeans | 95.0 /100 | #109 | Exceptional $63,779 |
| Immigrants | Zimbabwe | 94.3 /100 | #110 | Exceptional $63,643 |
| Immigrants | Spain | 93.7 /100 | #111 | Exceptional $63,540 |
| Syrians | 93.4 /100 | #112 | Exceptional $63,494 |
| Immigrants | Serbia | 92.7 /100 | #113 | Exceptional $63,387 |
| Immigrants | Saudi Arabia | 92.4 /100 | #114 | Exceptional $63,355 |
| Croatians | 91.4 /100 | #115 | Exceptional $63,225 |
| Guamanians/Chamorros | 91.1 /100 | #116 | Exceptional $63,187 |
| Immigrants | Croatia | 90.9 /100 | #117 | Exceptional $63,168 |