Spanish vs Yugoslavian Per Capita Income
COMPARE
Spanish
Yugoslavian
Per Capita Income
Per Capita Income Comparison
Spanish
Yugoslavians
$42,249
PER CAPITA INCOME
17.0/ 100
METRIC RATING
203rd/ 347
METRIC RANK
$42,792
PER CAPITA INCOME
27.4/ 100
METRIC RATING
191st/ 347
METRIC RANK
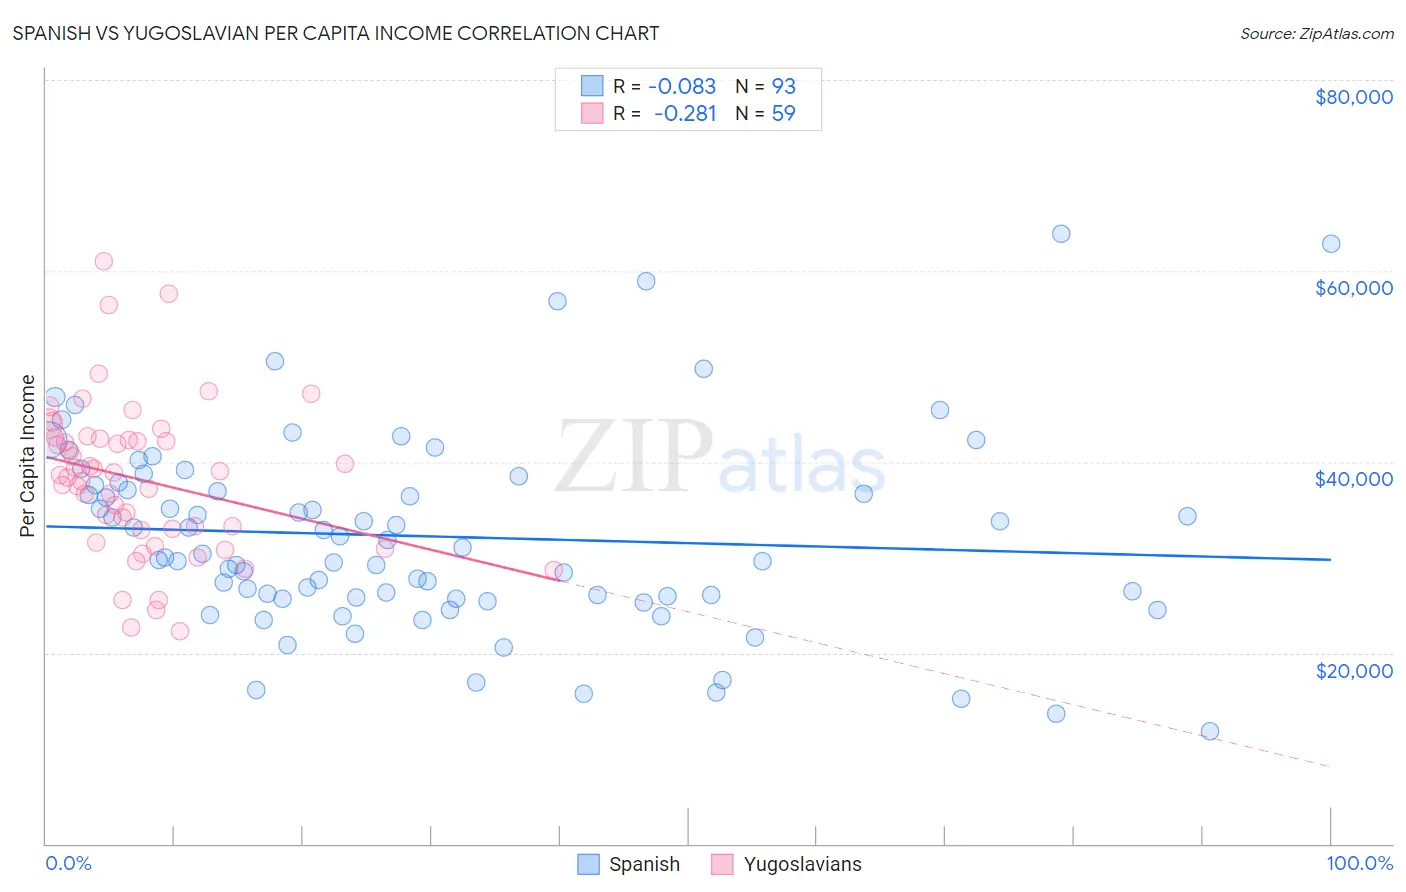
Spanish vs Yugoslavian Per Capita Income Correlation Chart
The statistical analysis conducted on geographies consisting of 422,211,321 people shows a slight negative correlation between the proportion of Spanish and per capita income in the United States with a correlation coefficient (R) of -0.083 and weighted average of $42,249. Similarly, the statistical analysis conducted on geographies consisting of 285,729,855 people shows a weak negative correlation between the proportion of Yugoslavians and per capita income in the United States with a correlation coefficient (R) of -0.281 and weighted average of $42,792, a difference of 1.3%.
Per Capita Income Correlation Summary
| Measurement | Spanish | Yugoslavian |
| Minimum | $11,849 | $22,217 |
| Maximum | $63,855 | $61,060 |
| Range | $52,006 | $38,843 |
| Mean | $32,202 | $38,123 |
| Median | $30,353 | $38,605 |
| Interquartile 25% (IQ1) | $25,756 | $32,828 |
| Interquartile 75% (IQ3) | $37,741 | $42,402 |
| Interquartile Range (IQR) | $11,984 | $9,574 |
| Standard Deviation (Sample) | $10,280 | $8,004 |
| Standard Deviation (Population) | $10,225 | $7,935 |
Demographics Similar to Spanish and Yugoslavians by Per Capita Income
In terms of per capita income, the demographic groups most similar to Spanish are Immigrants from Bosnia and Herzegovina ($42,278, a difference of 0.070%), Immigrants from Thailand ($42,289, a difference of 0.090%), Aleut ($42,210, a difference of 0.090%), White/Caucasian ($42,180, a difference of 0.16%), and Ghanaian ($42,164, a difference of 0.20%). Similarly, the demographic groups most similar to Yugoslavians are Kenyan ($42,808, a difference of 0.040%), Iraqi ($42,760, a difference of 0.070%), Immigrants from Sierra Leone ($42,752, a difference of 0.090%), Immigrants from Fiji ($42,694, a difference of 0.23%), and Bermudan ($42,911, a difference of 0.28%).
| Demographics | Rating | Rank | Per Capita Income |
| Immigrants | Colombia | 31.5 /100 | #187 | Fair $42,971 |
| Immigrants | Africa | 31.0 /100 | #188 | Fair $42,950 |
| Bermudans | 30.1 /100 | #189 | Fair $42,911 |
| Kenyans | 27.7 /100 | #190 | Fair $42,808 |
| Yugoslavians | 27.4 /100 | #191 | Fair $42,792 |
| Iraqis | 26.7 /100 | #192 | Fair $42,760 |
| Immigrants | Sierra Leone | 26.5 /100 | #193 | Fair $42,752 |
| Immigrants | Fiji | 25.2 /100 | #194 | Fair $42,694 |
| Immigrants | Kenya | 24.5 /100 | #195 | Fair $42,661 |
| Dutch | 23.4 /100 | #196 | Fair $42,605 |
| Scotch-Irish | 22.6 /100 | #197 | Fair $42,563 |
| Immigrants | Portugal | 19.7 /100 | #198 | Poor $42,412 |
| Barbadians | 19.6 /100 | #199 | Poor $42,406 |
| Vietnamese | 19.0 /100 | #200 | Poor $42,368 |
| Immigrants | Thailand | 17.6 /100 | #201 | Poor $42,289 |
| Immigrants | Bosnia and Herzegovina | 17.5 /100 | #202 | Poor $42,278 |
| Spanish | 17.0 /100 | #203 | Poor $42,249 |
| Aleuts | 16.4 /100 | #204 | Poor $42,210 |
| Whites/Caucasians | 15.9 /100 | #205 | Poor $42,180 |
| Ghanaians | 15.7 /100 | #206 | Poor $42,164 |
| Venezuelans | 14.4 /100 | #207 | Poor $42,074 |