Spanish vs Immigrants from Turkey Per Capita Income
COMPARE
Spanish
Immigrants from Turkey
Per Capita Income
Per Capita Income Comparison
Spanish
Immigrants from Turkey
$42,249
PER CAPITA INCOME
17.0/ 100
METRIC RATING
203rd/ 347
METRIC RANK
$51,368
PER CAPITA INCOME
100.0/ 100
METRIC RATING
42nd/ 347
METRIC RANK
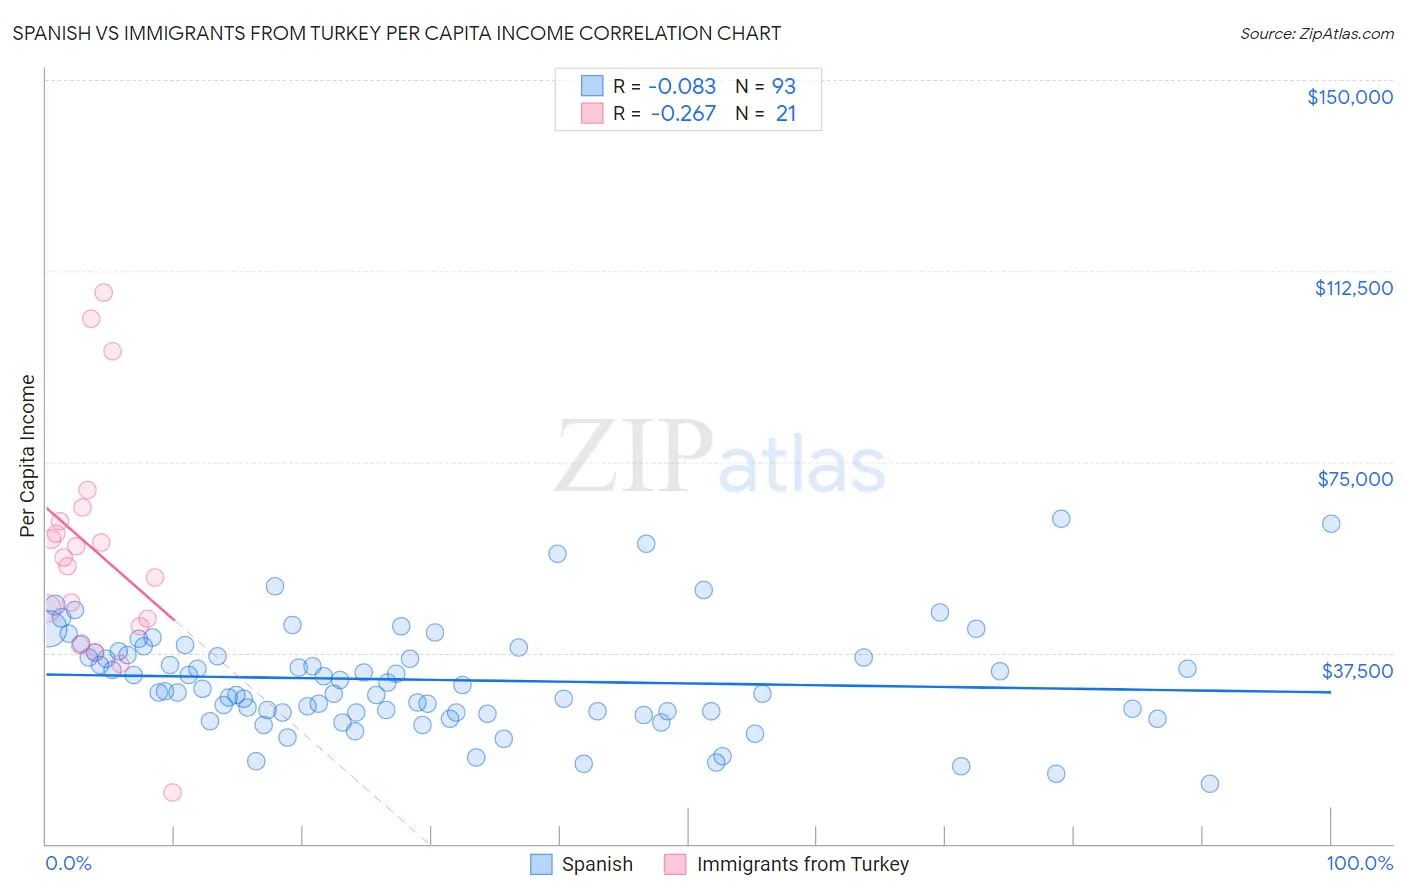
Spanish vs Immigrants from Turkey Per Capita Income Correlation Chart
The statistical analysis conducted on geographies consisting of 422,211,321 people shows a slight negative correlation between the proportion of Spanish and per capita income in the United States with a correlation coefficient (R) of -0.083 and weighted average of $42,249. Similarly, the statistical analysis conducted on geographies consisting of 223,057,840 people shows a weak negative correlation between the proportion of Immigrants from Turkey and per capita income in the United States with a correlation coefficient (R) of -0.267 and weighted average of $51,368, a difference of 21.6%.
Per Capita Income Correlation Summary
| Measurement | Spanish | Immigrants from Turkey |
| Minimum | $11,849 | $10,156 |
| Maximum | $63,855 | $108,195 |
| Range | $52,006 | $98,039 |
| Mean | $32,202 | $57,681 |
| Median | $30,353 | $56,181 |
| Interquartile 25% (IQ1) | $25,756 | $43,465 |
| Interquartile 75% (IQ3) | $37,741 | $64,694 |
| Interquartile Range (IQR) | $11,984 | $21,229 |
| Standard Deviation (Sample) | $10,280 | $23,007 |
| Standard Deviation (Population) | $10,225 | $22,452 |
Similar Demographics by Per Capita Income
Demographics Similar to Spanish by Per Capita Income
In terms of per capita income, the demographic groups most similar to Spanish are Immigrants from Bosnia and Herzegovina ($42,278, a difference of 0.070%), Immigrants from Thailand ($42,289, a difference of 0.090%), Aleut ($42,210, a difference of 0.090%), White/Caucasian ($42,180, a difference of 0.16%), and Ghanaian ($42,164, a difference of 0.20%).
| Demographics | Rating | Rank | Per Capita Income |
| Dutch | 23.4 /100 | #196 | Fair $42,605 |
| Scotch-Irish | 22.6 /100 | #197 | Fair $42,563 |
| Immigrants | Portugal | 19.7 /100 | #198 | Poor $42,412 |
| Barbadians | 19.6 /100 | #199 | Poor $42,406 |
| Vietnamese | 19.0 /100 | #200 | Poor $42,368 |
| Immigrants | Thailand | 17.6 /100 | #201 | Poor $42,289 |
| Immigrants | Bosnia and Herzegovina | 17.5 /100 | #202 | Poor $42,278 |
| Spanish | 17.0 /100 | #203 | Poor $42,249 |
| Aleuts | 16.4 /100 | #204 | Poor $42,210 |
| Whites/Caucasians | 15.9 /100 | #205 | Poor $42,180 |
| Ghanaians | 15.7 /100 | #206 | Poor $42,164 |
| Venezuelans | 14.4 /100 | #207 | Poor $42,074 |
| Panamanians | 13.9 /100 | #208 | Poor $42,035 |
| Immigrants | Sudan | 13.2 /100 | #209 | Poor $41,986 |
| Ecuadorians | 12.9 /100 | #210 | Poor $41,958 |
Demographics Similar to Immigrants from Turkey by Per Capita Income
In terms of per capita income, the demographic groups most similar to Immigrants from Turkey are Immigrants from Lithuania ($51,361, a difference of 0.010%), Immigrants from South Africa ($51,465, a difference of 0.19%), Immigrants from Korea ($51,671, a difference of 0.59%), Cambodian ($51,731, a difference of 0.71%), and Immigrants from Czechoslovakia ($51,770, a difference of 0.78%).
| Demographics | Rating | Rank | Per Capita Income |
| Burmese | 100.0 /100 | #35 | Exceptional $52,005 |
| Immigrants | Greece | 100.0 /100 | #36 | Exceptional $51,891 |
| Estonians | 100.0 /100 | #37 | Exceptional $51,875 |
| Immigrants | Czechoslovakia | 100.0 /100 | #38 | Exceptional $51,770 |
| Cambodians | 100.0 /100 | #39 | Exceptional $51,731 |
| Immigrants | Korea | 100.0 /100 | #40 | Exceptional $51,671 |
| Immigrants | South Africa | 100.0 /100 | #41 | Exceptional $51,465 |
| Immigrants | Turkey | 100.0 /100 | #42 | Exceptional $51,368 |
| Immigrants | Lithuania | 100.0 /100 | #43 | Exceptional $51,361 |
| Immigrants | Europe | 100.0 /100 | #44 | Exceptional $50,950 |
| Immigrants | Spain | 100.0 /100 | #45 | Exceptional $50,933 |
| Immigrants | Latvia | 100.0 /100 | #46 | Exceptional $50,914 |
| Bulgarians | 100.0 /100 | #47 | Exceptional $50,906 |
| Immigrants | Serbia | 100.0 /100 | #48 | Exceptional $50,810 |
| New Zealanders | 100.0 /100 | #49 | Exceptional $50,575 |