Spanish vs Seminole Per Capita Income
COMPARE
Spanish
Seminole
Per Capita Income
Per Capita Income Comparison
Spanish
Seminole
$42,249
PER CAPITA INCOME
17.0/ 100
METRIC RATING
203rd/ 347
METRIC RANK
$36,180
PER CAPITA INCOME
0.0/ 100
METRIC RATING
314th/ 347
METRIC RANK
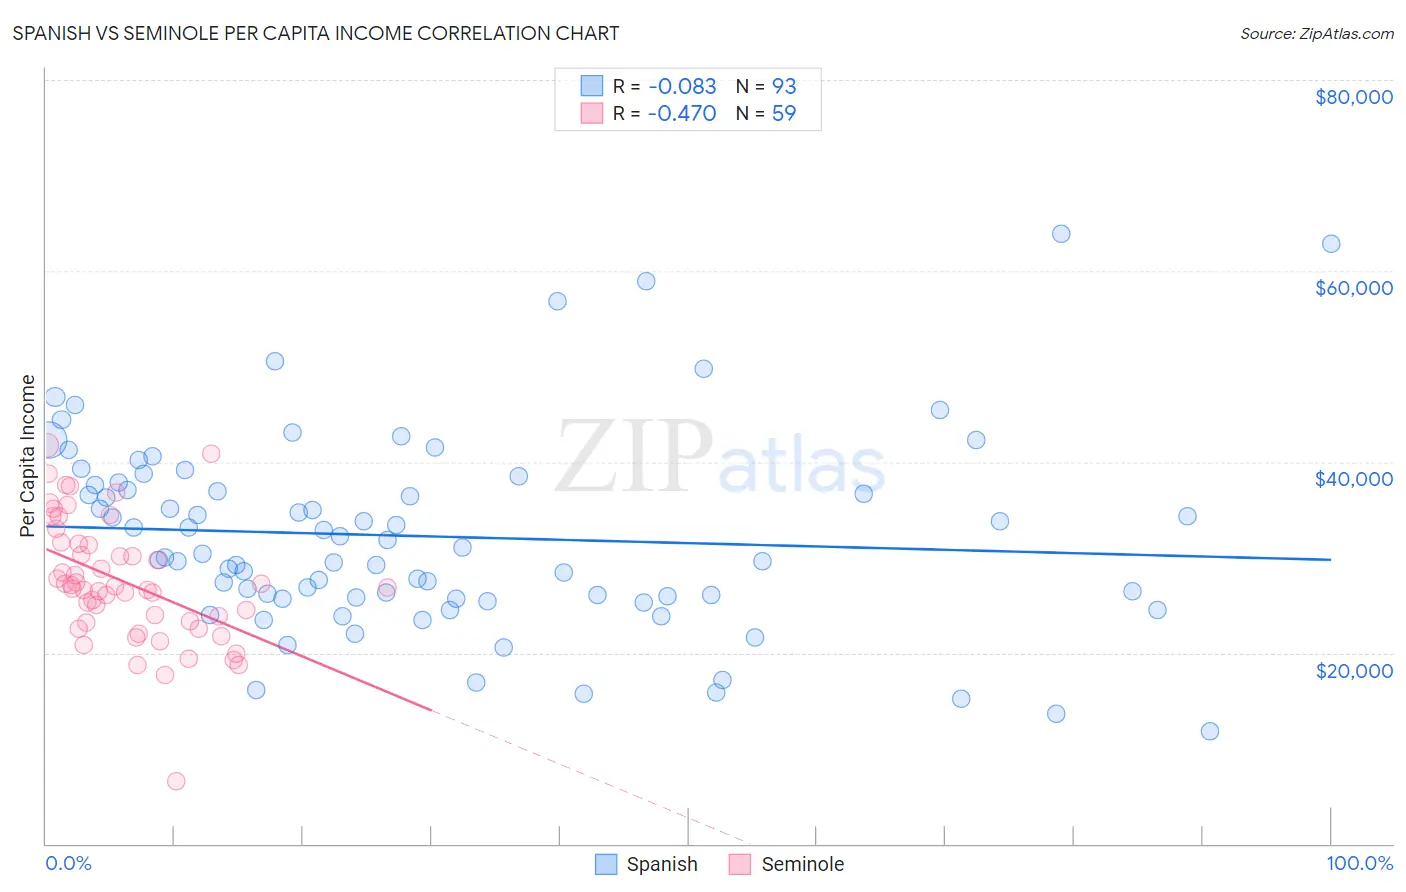
Spanish vs Seminole Per Capita Income Correlation Chart
The statistical analysis conducted on geographies consisting of 422,211,321 people shows a slight negative correlation between the proportion of Spanish and per capita income in the United States with a correlation coefficient (R) of -0.083 and weighted average of $42,249. Similarly, the statistical analysis conducted on geographies consisting of 118,313,864 people shows a moderate negative correlation between the proportion of Seminole and per capita income in the United States with a correlation coefficient (R) of -0.470 and weighted average of $36,180, a difference of 16.8%.
Per Capita Income Correlation Summary
| Measurement | Spanish | Seminole |
| Minimum | $11,849 | $6,596 |
| Maximum | $63,855 | $41,755 |
| Range | $52,006 | $35,159 |
| Mean | $32,202 | $27,427 |
| Median | $30,353 | $26,891 |
| Interquartile 25% (IQ1) | $25,756 | $23,175 |
| Interquartile 75% (IQ3) | $37,741 | $31,374 |
| Interquartile Range (IQR) | $11,984 | $8,199 |
| Standard Deviation (Sample) | $10,280 | $6,480 |
| Standard Deviation (Population) | $10,225 | $6,425 |
Similar Demographics by Per Capita Income
Demographics Similar to Spanish by Per Capita Income
In terms of per capita income, the demographic groups most similar to Spanish are Immigrants from Bosnia and Herzegovina ($42,278, a difference of 0.070%), Immigrants from Thailand ($42,289, a difference of 0.090%), Aleut ($42,210, a difference of 0.090%), White/Caucasian ($42,180, a difference of 0.16%), and Ghanaian ($42,164, a difference of 0.20%).
| Demographics | Rating | Rank | Per Capita Income |
| Dutch | 23.4 /100 | #196 | Fair $42,605 |
| Scotch-Irish | 22.6 /100 | #197 | Fair $42,563 |
| Immigrants | Portugal | 19.7 /100 | #198 | Poor $42,412 |
| Barbadians | 19.6 /100 | #199 | Poor $42,406 |
| Vietnamese | 19.0 /100 | #200 | Poor $42,368 |
| Immigrants | Thailand | 17.6 /100 | #201 | Poor $42,289 |
| Immigrants | Bosnia and Herzegovina | 17.5 /100 | #202 | Poor $42,278 |
| Spanish | 17.0 /100 | #203 | Poor $42,249 |
| Aleuts | 16.4 /100 | #204 | Poor $42,210 |
| Whites/Caucasians | 15.9 /100 | #205 | Poor $42,180 |
| Ghanaians | 15.7 /100 | #206 | Poor $42,164 |
| Venezuelans | 14.4 /100 | #207 | Poor $42,074 |
| Panamanians | 13.9 /100 | #208 | Poor $42,035 |
| Immigrants | Sudan | 13.2 /100 | #209 | Poor $41,986 |
| Ecuadorians | 12.9 /100 | #210 | Poor $41,958 |
Demographics Similar to Seminole by Per Capita Income
In terms of per capita income, the demographic groups most similar to Seminole are Yaqui ($36,112, a difference of 0.19%), Choctaw ($35,999, a difference of 0.50%), Bahamian ($36,427, a difference of 0.68%), Dutch West Indian ($35,922, a difference of 0.72%), and Bangladeshi ($35,897, a difference of 0.79%).
| Demographics | Rating | Rank | Per Capita Income |
| Immigrants | Latin America | 0.0 /100 | #307 | Tragic $36,823 |
| Fijians | 0.0 /100 | #308 | Tragic $36,690 |
| Immigrants | Honduras | 0.0 /100 | #309 | Tragic $36,665 |
| Ute | 0.0 /100 | #310 | Tragic $36,651 |
| Chippewa | 0.0 /100 | #311 | Tragic $36,631 |
| Chickasaw | 0.0 /100 | #312 | Tragic $36,475 |
| Bahamians | 0.0 /100 | #313 | Tragic $36,427 |
| Seminole | 0.0 /100 | #314 | Tragic $36,180 |
| Yaqui | 0.0 /100 | #315 | Tragic $36,112 |
| Choctaw | 0.0 /100 | #316 | Tragic $35,999 |
| Dutch West Indians | 0.0 /100 | #317 | Tragic $35,922 |
| Bangladeshis | 0.0 /100 | #318 | Tragic $35,897 |
| Immigrants | Congo | 0.0 /100 | #319 | Tragic $35,720 |
| Hispanics or Latinos | 0.0 /100 | #320 | Tragic $35,688 |
| Blacks/African Americans | 0.0 /100 | #321 | Tragic $35,564 |