Spanish vs Austrian Median Male Earnings
COMPARE
Spanish
Austrian
Median Male Earnings
Median Male Earnings Comparison
Spanish
Austrians
$53,576
MEDIAN MALE EARNINGS
29.0/ 100
METRIC RATING
194th/ 347
METRIC RANK
$59,359
MEDIAN MALE EARNINGS
99.2/ 100
METRIC RATING
90th/ 347
METRIC RANK
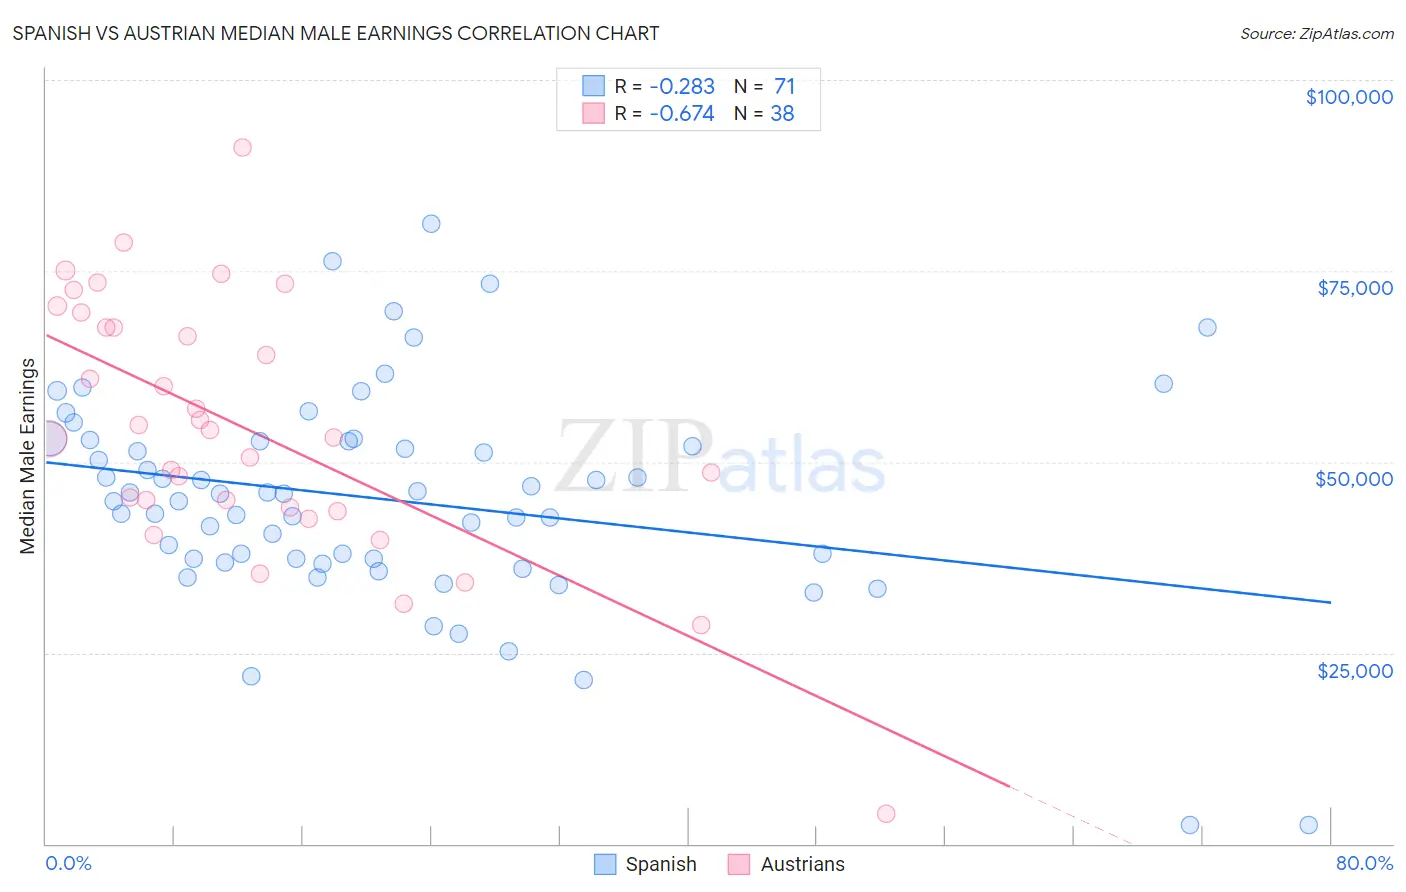
Spanish vs Austrian Median Male Earnings Correlation Chart
The statistical analysis conducted on geographies consisting of 421,997,889 people shows a weak negative correlation between the proportion of Spanish and median male earnings in the United States with a correlation coefficient (R) of -0.283 and weighted average of $53,576. Similarly, the statistical analysis conducted on geographies consisting of 451,854,520 people shows a significant negative correlation between the proportion of Austrians and median male earnings in the United States with a correlation coefficient (R) of -0.674 and weighted average of $59,359, a difference of 10.8%.
Median Male Earnings Correlation Summary
| Measurement | Spanish | Austrian |
| Minimum | $2,499 | $3,902 |
| Maximum | $81,250 | $91,143 |
| Range | $78,751 | $87,241 |
| Mean | $45,106 | $54,430 |
| Median | $45,773 | $53,632 |
| Interquartile 25% (IQ1) | $37,348 | $43,967 |
| Interquartile 75% (IQ3) | $52,702 | $67,629 |
| Interquartile Range (IQR) | $15,354 | $23,662 |
| Standard Deviation (Sample) | $14,070 | $16,958 |
| Standard Deviation (Population) | $13,971 | $16,734 |
Similar Demographics by Median Male Earnings
Demographics Similar to Spanish by Median Male Earnings
In terms of median male earnings, the demographic groups most similar to Spanish are Kenyan ($53,647, a difference of 0.13%), Immigrants from the Azores ($53,503, a difference of 0.14%), Scotch-Irish ($53,658, a difference of 0.15%), Guamanian/Chamorro ($53,661, a difference of 0.16%), and Uruguayan ($53,680, a difference of 0.19%).
| Demographics | Rating | Rank | Median Male Earnings |
| Immigrants | Eritrea | 31.8 /100 | #187 | Fair $53,715 |
| Immigrants | Eastern Africa | 31.8 /100 | #188 | Fair $53,713 |
| Puget Sound Salish | 31.6 /100 | #189 | Fair $53,704 |
| Uruguayans | 31.1 /100 | #190 | Fair $53,680 |
| Guamanians/Chamorros | 30.7 /100 | #191 | Fair $53,661 |
| Scotch-Irish | 30.6 /100 | #192 | Fair $53,658 |
| Kenyans | 30.4 /100 | #193 | Fair $53,647 |
| Spanish | 29.0 /100 | #194 | Fair $53,576 |
| Immigrants | Azores | 27.5 /100 | #195 | Fair $53,503 |
| Immigrants | Africa | 26.6 /100 | #196 | Fair $53,457 |
| Immigrants | Kenya | 26.0 /100 | #197 | Fair $53,427 |
| Immigrants | Costa Rica | 22.6 /100 | #198 | Fair $53,237 |
| Tongans | 22.3 /100 | #199 | Fair $53,218 |
| Immigrants | Thailand | 17.5 /100 | #200 | Poor $52,908 |
| Immigrants | Bosnia and Herzegovina | 16.9 /100 | #201 | Poor $52,869 |
Demographics Similar to Austrians by Median Male Earnings
In terms of median male earnings, the demographic groups most similar to Austrians are Laotian ($59,351, a difference of 0.010%), Immigrants from Moldova ($59,417, a difference of 0.10%), Immigrants from Kazakhstan ($59,278, a difference of 0.14%), Immigrants from Argentina ($59,491, a difference of 0.22%), and Immigrants from Southern Europe ($59,217, a difference of 0.24%).
| Demographics | Rating | Rank | Median Male Earnings |
| Immigrants | Italy | 99.4 /100 | #83 | Exceptional $59,691 |
| Afghans | 99.3 /100 | #84 | Exceptional $59,554 |
| Italians | 99.3 /100 | #85 | Exceptional $59,551 |
| Immigrants | England | 99.3 /100 | #86 | Exceptional $59,527 |
| Macedonians | 99.3 /100 | #87 | Exceptional $59,522 |
| Immigrants | Argentina | 99.3 /100 | #88 | Exceptional $59,491 |
| Immigrants | Moldova | 99.2 /100 | #89 | Exceptional $59,417 |
| Austrians | 99.2 /100 | #90 | Exceptional $59,359 |
| Laotians | 99.2 /100 | #91 | Exceptional $59,351 |
| Immigrants | Kazakhstan | 99.1 /100 | #92 | Exceptional $59,278 |
| Immigrants | Southern Europe | 99.0 /100 | #93 | Exceptional $59,217 |
| Immigrants | North Macedonia | 99.0 /100 | #94 | Exceptional $59,189 |
| Immigrants | Lebanon | 98.6 /100 | #95 | Exceptional $58,835 |
| Albanians | 98.4 /100 | #96 | Exceptional $58,680 |
| Northern Europeans | 98.2 /100 | #97 | Exceptional $58,588 |