Spanish vs Immigrants from Uzbekistan Median Male Earnings
COMPARE
Spanish
Immigrants from Uzbekistan
Median Male Earnings
Median Male Earnings Comparison
Spanish
Immigrants from Uzbekistan
$53,576
MEDIAN MALE EARNINGS
29.0/ 100
METRIC RATING
194th/ 347
METRIC RANK
$57,941
MEDIAN MALE EARNINGS
96.7/ 100
METRIC RATING
108th/ 347
METRIC RANK
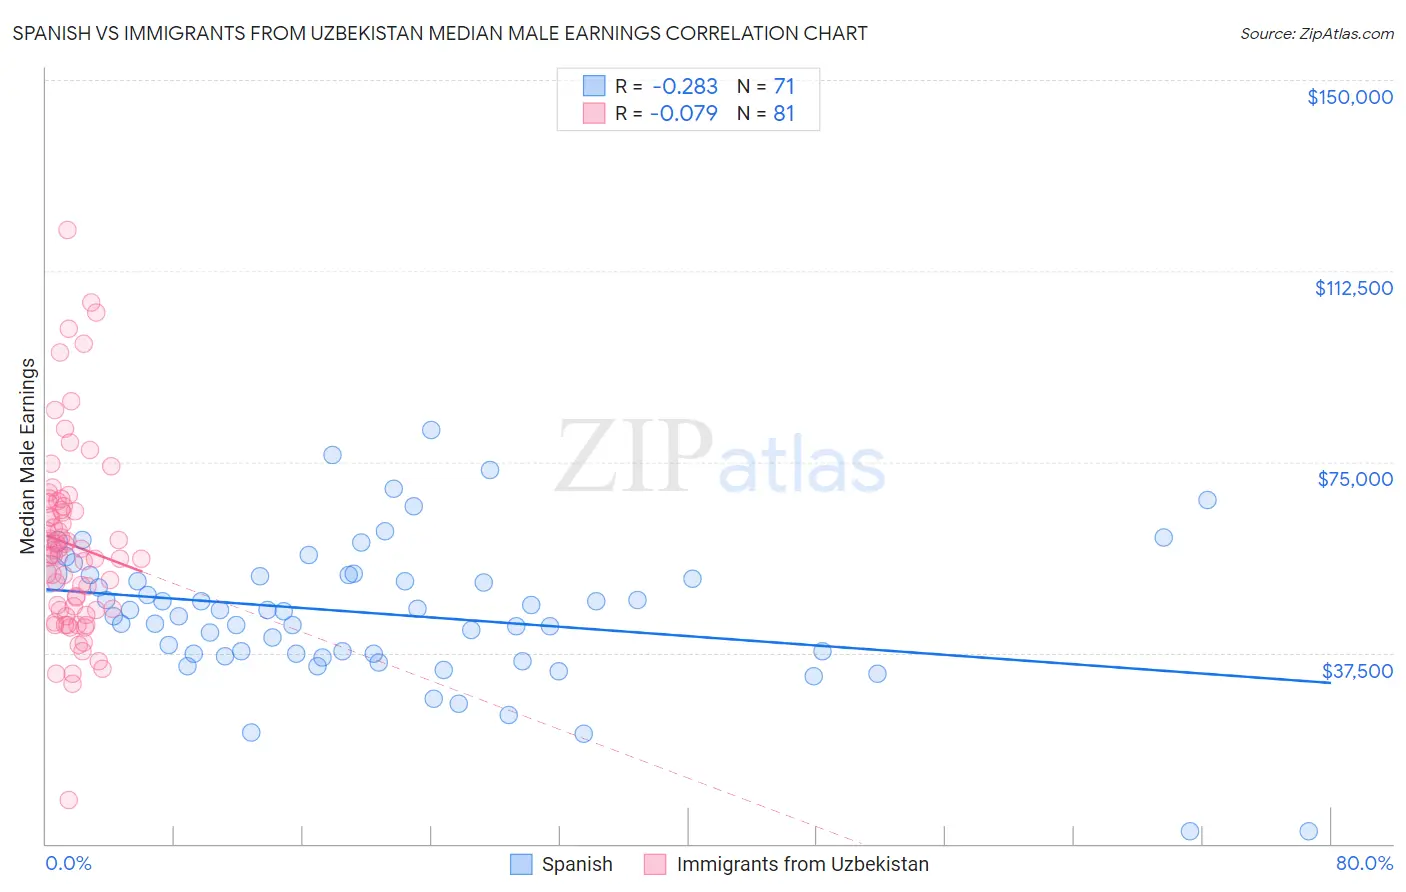
Spanish vs Immigrants from Uzbekistan Median Male Earnings Correlation Chart
The statistical analysis conducted on geographies consisting of 421,997,889 people shows a weak negative correlation between the proportion of Spanish and median male earnings in the United States with a correlation coefficient (R) of -0.283 and weighted average of $53,576. Similarly, the statistical analysis conducted on geographies consisting of 118,770,599 people shows a slight negative correlation between the proportion of Immigrants from Uzbekistan and median male earnings in the United States with a correlation coefficient (R) of -0.079 and weighted average of $57,941, a difference of 8.2%.
Median Male Earnings Correlation Summary
| Measurement | Spanish | Immigrants from Uzbekistan |
| Minimum | $2,499 | $8,518 |
| Maximum | $81,250 | $120,441 |
| Range | $78,751 | $111,923 |
| Mean | $45,106 | $58,740 |
| Median | $45,773 | $56,668 |
| Interquartile 25% (IQ1) | $37,348 | $45,939 |
| Interquartile 75% (IQ3) | $52,702 | $66,644 |
| Interquartile Range (IQR) | $15,354 | $20,705 |
| Standard Deviation (Sample) | $14,070 | $18,622 |
| Standard Deviation (Population) | $13,971 | $18,506 |
Similar Demographics by Median Male Earnings
Demographics Similar to Spanish by Median Male Earnings
In terms of median male earnings, the demographic groups most similar to Spanish are Kenyan ($53,647, a difference of 0.13%), Immigrants from the Azores ($53,503, a difference of 0.14%), Scotch-Irish ($53,658, a difference of 0.15%), Guamanian/Chamorro ($53,661, a difference of 0.16%), and Uruguayan ($53,680, a difference of 0.19%).
| Demographics | Rating | Rank | Median Male Earnings |
| Immigrants | Eritrea | 31.8 /100 | #187 | Fair $53,715 |
| Immigrants | Eastern Africa | 31.8 /100 | #188 | Fair $53,713 |
| Puget Sound Salish | 31.6 /100 | #189 | Fair $53,704 |
| Uruguayans | 31.1 /100 | #190 | Fair $53,680 |
| Guamanians/Chamorros | 30.7 /100 | #191 | Fair $53,661 |
| Scotch-Irish | 30.6 /100 | #192 | Fair $53,658 |
| Kenyans | 30.4 /100 | #193 | Fair $53,647 |
| Spanish | 29.0 /100 | #194 | Fair $53,576 |
| Immigrants | Azores | 27.5 /100 | #195 | Fair $53,503 |
| Immigrants | Africa | 26.6 /100 | #196 | Fair $53,457 |
| Immigrants | Kenya | 26.0 /100 | #197 | Fair $53,427 |
| Immigrants | Costa Rica | 22.6 /100 | #198 | Fair $53,237 |
| Tongans | 22.3 /100 | #199 | Fair $53,218 |
| Immigrants | Thailand | 17.5 /100 | #200 | Poor $52,908 |
| Immigrants | Bosnia and Herzegovina | 16.9 /100 | #201 | Poor $52,869 |
Demographics Similar to Immigrants from Uzbekistan by Median Male Earnings
In terms of median male earnings, the demographic groups most similar to Immigrants from Uzbekistan are Serbian ($57,975, a difference of 0.060%), British ($57,890, a difference of 0.090%), Immigrants from Northern Africa ($58,008, a difference of 0.12%), Palestinian ($57,778, a difference of 0.28%), and Armenian ($58,134, a difference of 0.33%).
| Demographics | Rating | Rank | Median Male Earnings |
| Immigrants | Brazil | 97.7 /100 | #101 | Exceptional $58,324 |
| Syrians | 97.4 /100 | #102 | Exceptional $58,187 |
| Poles | 97.3 /100 | #103 | Exceptional $58,139 |
| Armenians | 97.3 /100 | #104 | Exceptional $58,134 |
| Immigrants | Western Asia | 97.3 /100 | #105 | Exceptional $58,131 |
| Immigrants | Northern Africa | 96.9 /100 | #106 | Exceptional $58,008 |
| Serbians | 96.8 /100 | #107 | Exceptional $57,975 |
| Immigrants | Uzbekistan | 96.7 /100 | #108 | Exceptional $57,941 |
| British | 96.5 /100 | #109 | Exceptional $57,890 |
| Palestinians | 96.2 /100 | #110 | Exceptional $57,778 |
| Europeans | 95.6 /100 | #111 | Exceptional $57,637 |
| Immigrants | Afghanistan | 95.4 /100 | #112 | Exceptional $57,582 |
| Carpatho Rusyns | 95.3 /100 | #113 | Exceptional $57,572 |
| Immigrants | Kuwait | 95.3 /100 | #114 | Exceptional $57,562 |
| Swedes | 94.8 /100 | #115 | Exceptional $57,445 |