Spanish vs Immigrants from Zaire Median Male Earnings
COMPARE
Spanish
Immigrants from Zaire
Median Male Earnings
Median Male Earnings Comparison
Spanish
Immigrants from Zaire
$53,576
MEDIAN MALE EARNINGS
29.0/ 100
METRIC RATING
194th/ 347
METRIC RANK
$47,070
MEDIAN MALE EARNINGS
0.1/ 100
METRIC RATING
299th/ 347
METRIC RANK
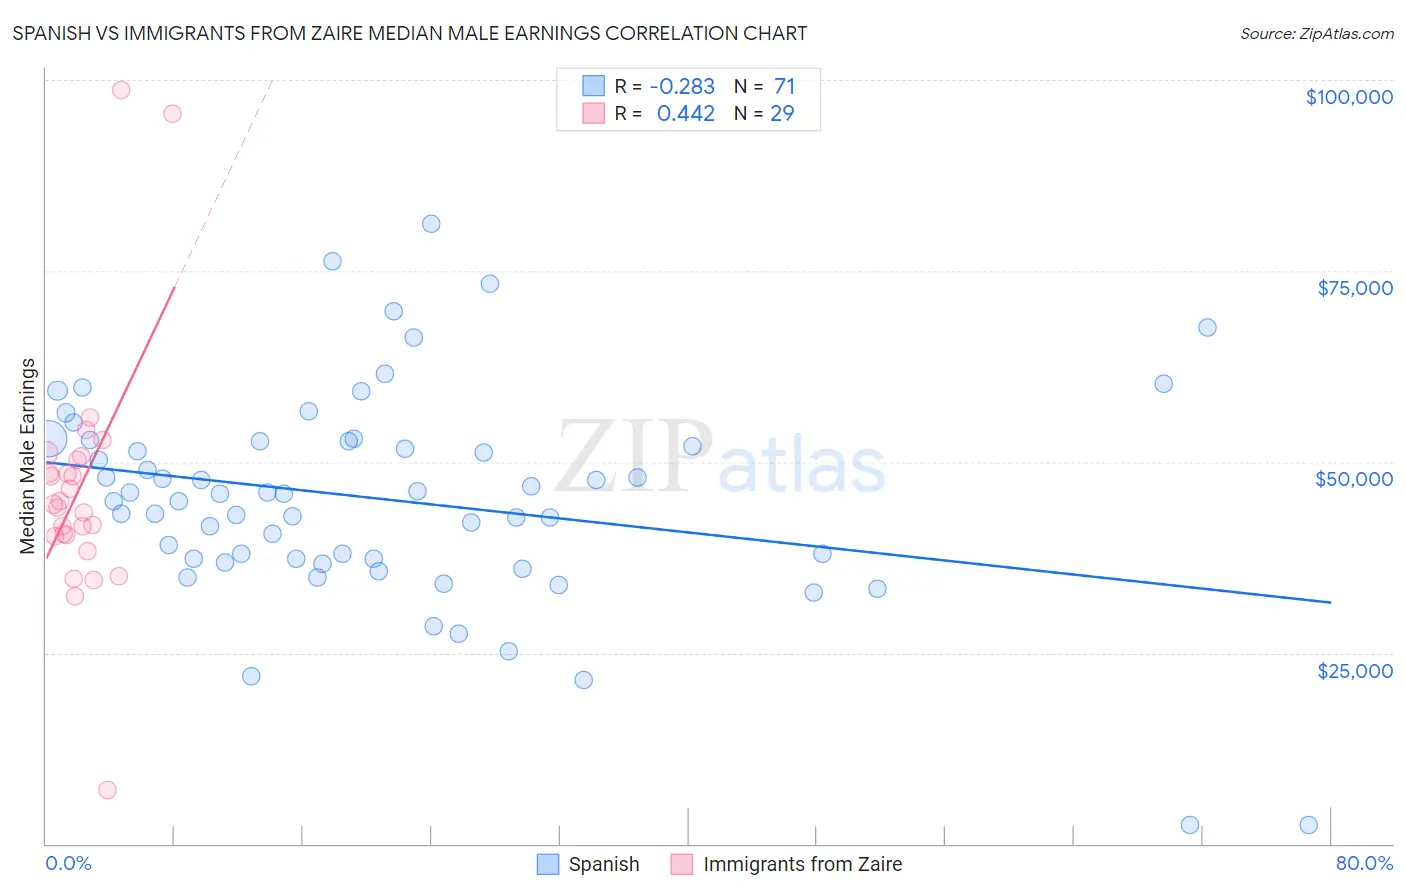
Spanish vs Immigrants from Zaire Median Male Earnings Correlation Chart
The statistical analysis conducted on geographies consisting of 421,997,889 people shows a weak negative correlation between the proportion of Spanish and median male earnings in the United States with a correlation coefficient (R) of -0.283 and weighted average of $53,576. Similarly, the statistical analysis conducted on geographies consisting of 107,252,506 people shows a moderate positive correlation between the proportion of Immigrants from Zaire and median male earnings in the United States with a correlation coefficient (R) of 0.442 and weighted average of $47,070, a difference of 13.8%.
Median Male Earnings Correlation Summary
| Measurement | Spanish | Immigrants from Zaire |
| Minimum | $2,499 | $7,065 |
| Maximum | $81,250 | $98,750 |
| Range | $78,751 | $91,685 |
| Mean | $45,106 | $46,699 |
| Median | $45,773 | $44,438 |
| Interquartile 25% (IQ1) | $37,348 | $40,386 |
| Interquartile 75% (IQ3) | $52,702 | $50,511 |
| Interquartile Range (IQR) | $15,354 | $10,125 |
| Standard Deviation (Sample) | $14,070 | $16,725 |
| Standard Deviation (Population) | $13,971 | $16,434 |
Similar Demographics by Median Male Earnings
Demographics Similar to Spanish by Median Male Earnings
In terms of median male earnings, the demographic groups most similar to Spanish are Kenyan ($53,647, a difference of 0.13%), Immigrants from the Azores ($53,503, a difference of 0.14%), Scotch-Irish ($53,658, a difference of 0.15%), Guamanian/Chamorro ($53,661, a difference of 0.16%), and Uruguayan ($53,680, a difference of 0.19%).
| Demographics | Rating | Rank | Median Male Earnings |
| Immigrants | Eritrea | 31.8 /100 | #187 | Fair $53,715 |
| Immigrants | Eastern Africa | 31.8 /100 | #188 | Fair $53,713 |
| Puget Sound Salish | 31.6 /100 | #189 | Fair $53,704 |
| Uruguayans | 31.1 /100 | #190 | Fair $53,680 |
| Guamanians/Chamorros | 30.7 /100 | #191 | Fair $53,661 |
| Scotch-Irish | 30.6 /100 | #192 | Fair $53,658 |
| Kenyans | 30.4 /100 | #193 | Fair $53,647 |
| Spanish | 29.0 /100 | #194 | Fair $53,576 |
| Immigrants | Azores | 27.5 /100 | #195 | Fair $53,503 |
| Immigrants | Africa | 26.6 /100 | #196 | Fair $53,457 |
| Immigrants | Kenya | 26.0 /100 | #197 | Fair $53,427 |
| Immigrants | Costa Rica | 22.6 /100 | #198 | Fair $53,237 |
| Tongans | 22.3 /100 | #199 | Fair $53,218 |
| Immigrants | Thailand | 17.5 /100 | #200 | Poor $52,908 |
| Immigrants | Bosnia and Herzegovina | 16.9 /100 | #201 | Poor $52,869 |
Demographics Similar to Immigrants from Zaire by Median Male Earnings
In terms of median male earnings, the demographic groups most similar to Immigrants from Zaire are U.S. Virgin Islander ($47,066, a difference of 0.010%), Immigrants from Micronesia ($47,177, a difference of 0.23%), Dominican ($47,204, a difference of 0.28%), Immigrants from Latin America ($46,941, a difference of 0.28%), and Inupiat ($47,281, a difference of 0.45%).
| Demographics | Rating | Rank | Median Male Earnings |
| Immigrants | Dominica | 0.1 /100 | #292 | Tragic $47,651 |
| Indonesians | 0.1 /100 | #293 | Tragic $47,503 |
| Immigrants | Nicaragua | 0.1 /100 | #294 | Tragic $47,482 |
| Central American Indians | 0.1 /100 | #295 | Tragic $47,433 |
| Inupiat | 0.1 /100 | #296 | Tragic $47,281 |
| Dominicans | 0.1 /100 | #297 | Tragic $47,204 |
| Immigrants | Micronesia | 0.1 /100 | #298 | Tragic $47,177 |
| Immigrants | Zaire | 0.1 /100 | #299 | Tragic $47,070 |
| U.S. Virgin Islanders | 0.1 /100 | #300 | Tragic $47,066 |
| Immigrants | Latin America | 0.1 /100 | #301 | Tragic $46,941 |
| Seminole | 0.1 /100 | #302 | Tragic $46,783 |
| Yaqui | 0.1 /100 | #303 | Tragic $46,777 |
| Bangladeshis | 0.1 /100 | #304 | Tragic $46,744 |
| Guatemalans | 0.0 /100 | #305 | Tragic $46,736 |
| Dutch West Indians | 0.0 /100 | #306 | Tragic $46,656 |