Spanish vs Immigrants from Liberia In Labor Force | Age > 16
COMPARE
Spanish
Immigrants from Liberia
In Labor Force | Age > 16
In Labor Force | Age > 16 Comparison
Spanish
Immigrants from Liberia
63.9%
IN LABOR FORCE | AGE > 16
0.1/ 100
METRIC RATING
288th/ 347
METRIC RANK
67.6%
IN LABOR FORCE | AGE > 16
100.0/ 100
METRIC RATING
18th/ 347
METRIC RANK
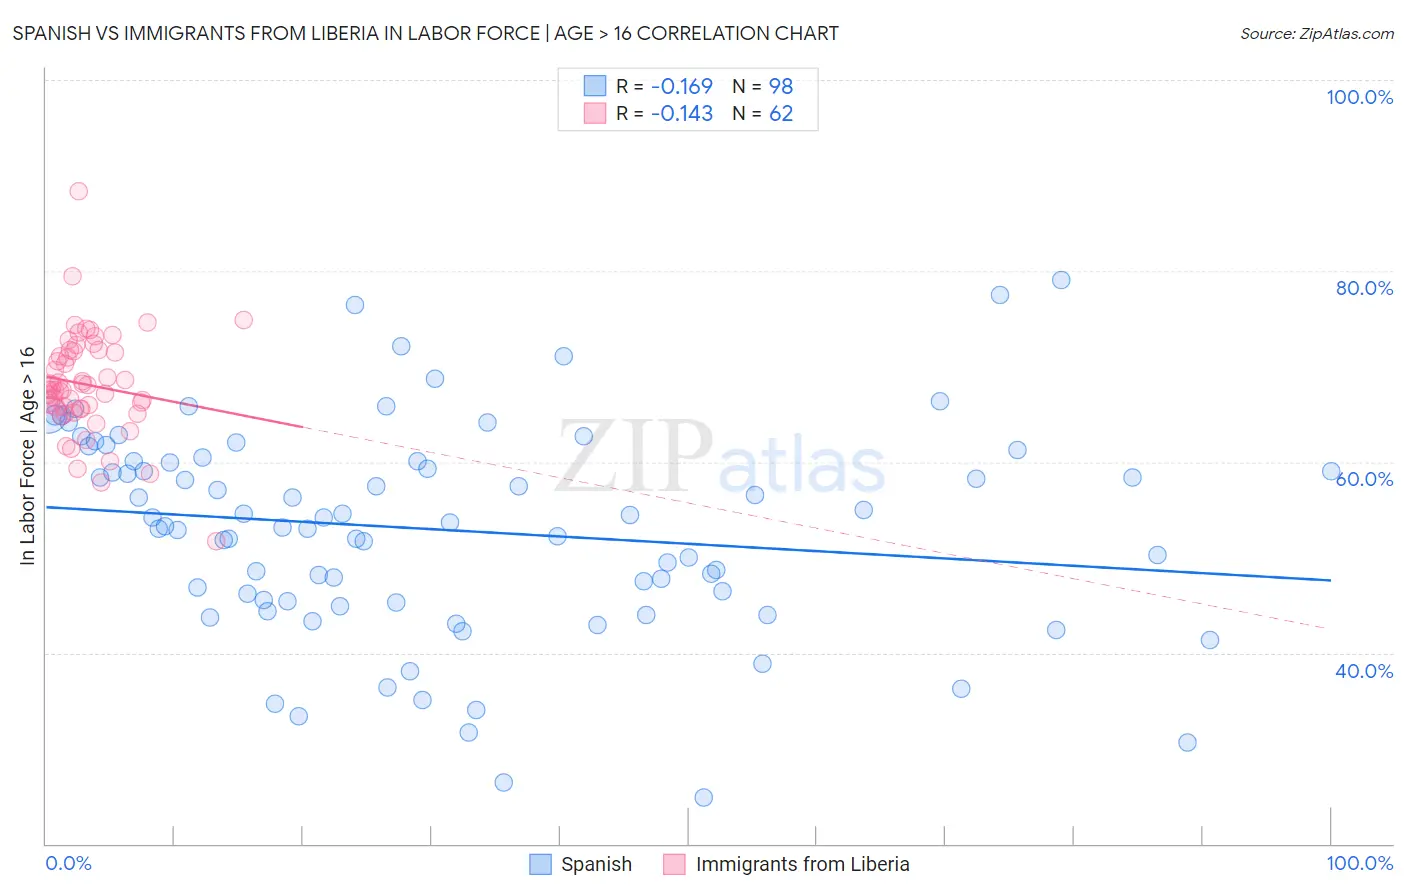
Spanish vs Immigrants from Liberia In Labor Force | Age > 16 Correlation Chart
The statistical analysis conducted on geographies consisting of 422,185,482 people shows a poor negative correlation between the proportion of Spanish and labor force participation rate among population ages 16 and over in the United States with a correlation coefficient (R) of -0.169 and weighted average of 63.9%. Similarly, the statistical analysis conducted on geographies consisting of 135,283,849 people shows a poor negative correlation between the proportion of Immigrants from Liberia and labor force participation rate among population ages 16 and over in the United States with a correlation coefficient (R) of -0.143 and weighted average of 67.6%, a difference of 5.9%.
In Labor Force | Age > 16 Correlation Summary
| Measurement | Spanish | Immigrants from Liberia |
| Minimum | 24.8% | 51.7% |
| Maximum | 79.0% | 88.3% |
| Range | 54.2% | 36.6% |
| Mean | 52.9% | 68.1% |
| Median | 53.5% | 67.6% |
| Interquartile 25% (IQ1) | 45.4% | 65.6% |
| Interquartile 75% (IQ3) | 60.1% | 71.5% |
| Interquartile Range (IQR) | 14.7% | 6.0% |
| Standard Deviation (Sample) | 11.0% | 5.4% |
| Standard Deviation (Population) | 11.0% | 5.4% |
Similar Demographics by In Labor Force | Age > 16
Demographics Similar to Spanish by In Labor Force | Age > 16
In terms of in labor force | age > 16, the demographic groups most similar to Spanish are Celtic (63.8%, a difference of 0.030%), Immigrants from Austria (63.9%, a difference of 0.050%), Scottish (63.9%, a difference of 0.050%), Hungarian (63.8%, a difference of 0.060%), and Slovak (63.9%, a difference of 0.070%).
| Demographics | Rating | Rank | In Labor Force | Age > 16 |
| French Canadians | 0.2 /100 | #281 | Tragic 64.0% |
| Immigrants | Guyana | 0.2 /100 | #282 | Tragic 64.0% |
| Immigrants | Germany | 0.1 /100 | #283 | Tragic 63.9% |
| French | 0.1 /100 | #284 | Tragic 63.9% |
| Slovaks | 0.1 /100 | #285 | Tragic 63.9% |
| Immigrants | Austria | 0.1 /100 | #286 | Tragic 63.9% |
| Scottish | 0.1 /100 | #287 | Tragic 63.9% |
| Spanish | 0.1 /100 | #288 | Tragic 63.9% |
| Celtics | 0.1 /100 | #289 | Tragic 63.8% |
| Hungarians | 0.1 /100 | #290 | Tragic 63.8% |
| Nepalese | 0.1 /100 | #291 | Tragic 63.8% |
| Spanish American Indians | 0.1 /100 | #292 | Tragic 63.8% |
| English | 0.1 /100 | #293 | Tragic 63.7% |
| Puget Sound Salish | 0.0 /100 | #294 | Tragic 63.7% |
| Immigrants | Canada | 0.0 /100 | #295 | Tragic 63.7% |
Demographics Similar to Immigrants from Liberia by In Labor Force | Age > 16
In terms of in labor force | age > 16, the demographic groups most similar to Immigrants from Liberia are Immigrants from India (67.6%, a difference of 0.020%), Kenyan (67.6%, a difference of 0.040%), Immigrants from Sudan (67.7%, a difference of 0.090%), Immigrants from Kenya (67.6%, a difference of 0.090%), and Tongan (67.5%, a difference of 0.10%).
| Demographics | Rating | Rank | In Labor Force | Age > 16 |
| Bolivians | 100.0 /100 | #11 | Exceptional 68.2% |
| Sudanese | 100.0 /100 | #12 | Exceptional 68.0% |
| Immigrants | Nepal | 100.0 /100 | #13 | Exceptional 68.0% |
| Liberians | 100.0 /100 | #14 | Exceptional 67.8% |
| Immigrants | Middle Africa | 100.0 /100 | #15 | Exceptional 67.7% |
| Immigrants | Sudan | 100.0 /100 | #16 | Exceptional 67.7% |
| Immigrants | India | 100.0 /100 | #17 | Exceptional 67.6% |
| Immigrants | Liberia | 100.0 /100 | #18 | Exceptional 67.6% |
| Kenyans | 100.0 /100 | #19 | Exceptional 67.6% |
| Immigrants | Kenya | 100.0 /100 | #20 | Exceptional 67.6% |
| Tongans | 100.0 /100 | #21 | Exceptional 67.5% |
| Immigrants | Uganda | 100.0 /100 | #22 | Exceptional 67.5% |
| Cambodians | 100.0 /100 | #23 | Exceptional 67.4% |
| Ugandans | 100.0 /100 | #24 | Exceptional 67.4% |
| Immigrants | Africa | 100.0 /100 | #25 | Exceptional 67.4% |