Spanish American vs Black/African American Householder Income Ages 45 - 64 years
COMPARE
Spanish American
Black/African American
Householder Income Ages 45 - 64 years
Householder Income Ages 45 - 64 years Comparison
Spanish Americans
Blacks/African Americans
$87,836
HOUSEHOLDER INCOME AGES 45 - 64 YEARS
0.2/ 100
METRIC RATING
269th/ 347
METRIC RANK
$78,556
HOUSEHOLDER INCOME AGES 45 - 64 YEARS
0.0/ 100
METRIC RATING
332nd/ 347
METRIC RANK
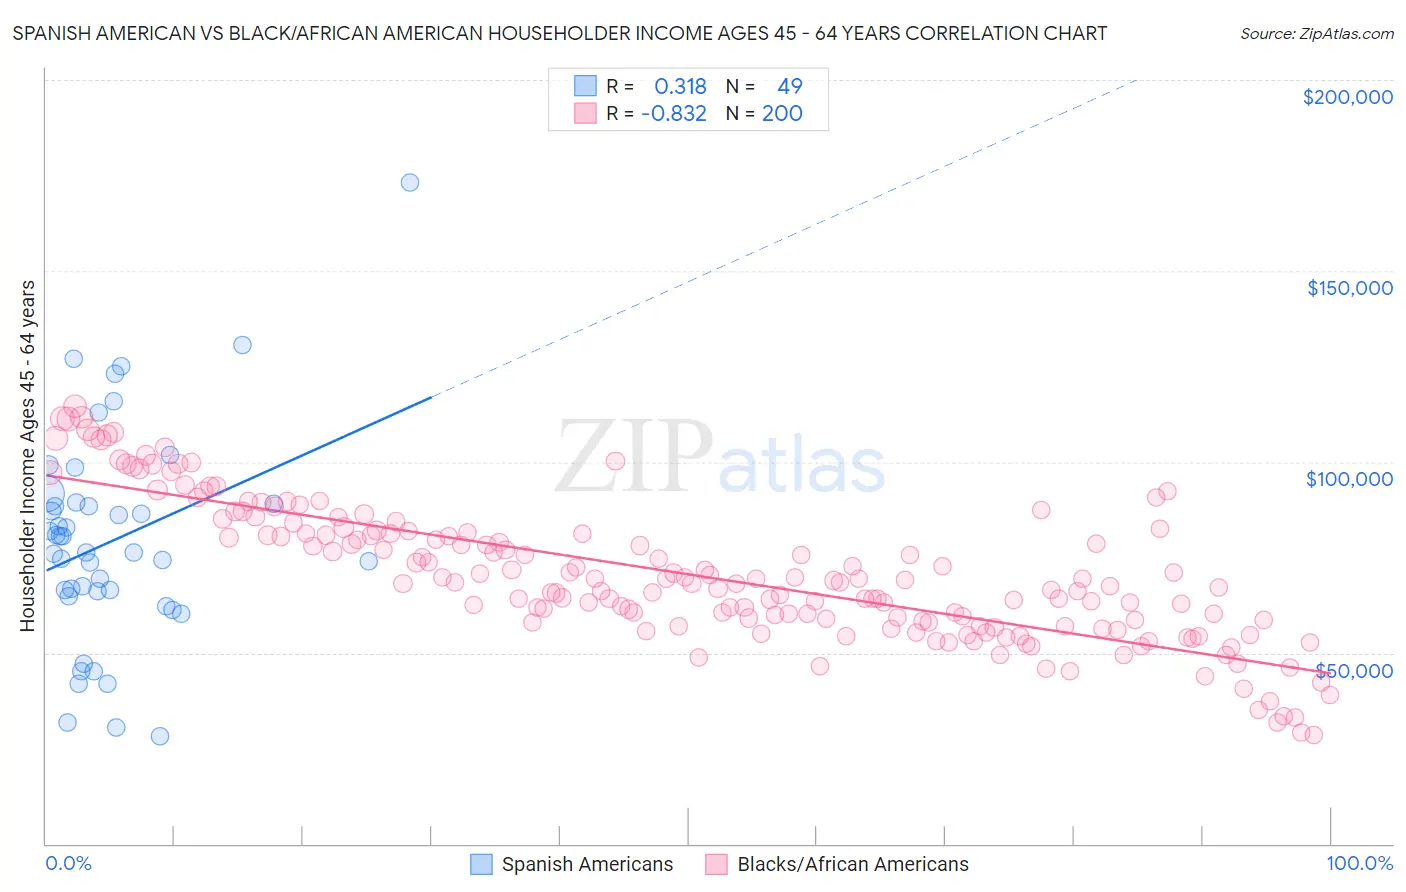
Spanish American vs Black/African American Householder Income Ages 45 - 64 years Correlation Chart
The statistical analysis conducted on geographies consisting of 103,142,376 people shows a mild positive correlation between the proportion of Spanish Americans and household income with householder between the ages 45 and 64 in the United States with a correlation coefficient (R) of 0.318 and weighted average of $87,836. Similarly, the statistical analysis conducted on geographies consisting of 562,323,408 people shows a very strong negative correlation between the proportion of Blacks/African Americans and household income with householder between the ages 45 and 64 in the United States with a correlation coefficient (R) of -0.832 and weighted average of $78,556, a difference of 11.8%.
Householder Income Ages 45 - 64 years Correlation Summary
| Measurement | Spanish American | Black/African American |
| Minimum | $28,021 | $28,578 |
| Maximum | $173,295 | $114,640 |
| Range | $145,274 | $86,063 |
| Mean | $79,401 | $70,559 |
| Median | $76,250 | $68,403 |
| Interquartile 25% (IQ1) | $65,439 | $58,195 |
| Interquartile 75% (IQ3) | $89,172 | $81,447 |
| Interquartile Range (IQR) | $23,734 | $23,253 |
| Standard Deviation (Sample) | $28,080 | $18,044 |
| Standard Deviation (Population) | $27,792 | $17,998 |
Similar Demographics by Householder Income Ages 45 - 64 years
Demographics Similar to Spanish Americans by Householder Income Ages 45 - 64 years
In terms of householder income ages 45 - 64 years, the demographic groups most similar to Spanish Americans are Immigrants from Micronesia ($87,864, a difference of 0.030%), Immigrants from Liberia ($87,739, a difference of 0.11%), Guatemalan ($87,705, a difference of 0.15%), Cape Verdean ($87,580, a difference of 0.29%), and Spanish American Indian ($87,561, a difference of 0.31%).
| Demographics | Rating | Rank | Householder Income Ages 45 - 64 years |
| Somalis | 0.3 /100 | #262 | Tragic $88,600 |
| Immigrants | Senegal | 0.3 /100 | #263 | Tragic $88,421 |
| Osage | 0.3 /100 | #264 | Tragic $88,390 |
| Jamaicans | 0.2 /100 | #265 | Tragic $88,327 |
| Immigrants | West Indies | 0.2 /100 | #266 | Tragic $88,164 |
| Hmong | 0.2 /100 | #267 | Tragic $88,115 |
| Immigrants | Micronesia | 0.2 /100 | #268 | Tragic $87,864 |
| Spanish Americans | 0.2 /100 | #269 | Tragic $87,836 |
| Immigrants | Liberia | 0.2 /100 | #270 | Tragic $87,739 |
| Guatemalans | 0.2 /100 | #271 | Tragic $87,705 |
| Cape Verdeans | 0.2 /100 | #272 | Tragic $87,580 |
| Spanish American Indians | 0.2 /100 | #273 | Tragic $87,561 |
| Iroquois | 0.1 /100 | #274 | Tragic $87,255 |
| Immigrants | Belize | 0.1 /100 | #275 | Tragic $87,229 |
| Immigrants | Latin America | 0.1 /100 | #276 | Tragic $87,219 |
Demographics Similar to Blacks/African Americans by Householder Income Ages 45 - 64 years
In terms of householder income ages 45 - 64 years, the demographic groups most similar to Blacks/African Americans are Immigrants from Dominican Republic ($78,836, a difference of 0.36%), Creek ($78,960, a difference of 0.51%), Dutch West Indian ($79,171, a difference of 0.78%), Immigrants from Congo ($77,850, a difference of 0.91%), and Native/Alaskan ($79,816, a difference of 1.6%).
| Demographics | Rating | Rank | Householder Income Ages 45 - 64 years |
| Immigrants | Cuba | 0.0 /100 | #325 | Tragic $80,662 |
| Dominicans | 0.0 /100 | #326 | Tragic $80,623 |
| Seminole | 0.0 /100 | #327 | Tragic $80,077 |
| Natives/Alaskans | 0.0 /100 | #328 | Tragic $79,816 |
| Dutch West Indians | 0.0 /100 | #329 | Tragic $79,171 |
| Creek | 0.0 /100 | #330 | Tragic $78,960 |
| Immigrants | Dominican Republic | 0.0 /100 | #331 | Tragic $78,836 |
| Blacks/African Americans | 0.0 /100 | #332 | Tragic $78,556 |
| Immigrants | Congo | 0.0 /100 | #333 | Tragic $77,850 |
| Menominee | 0.0 /100 | #334 | Tragic $76,903 |
| Cheyenne | 0.0 /100 | #335 | Tragic $76,362 |
| Arapaho | 0.0 /100 | #336 | Tragic $75,945 |
| Pueblo | 0.0 /100 | #337 | Tragic $75,601 |
| Hopi | 0.0 /100 | #338 | Tragic $75,562 |
| Kiowa | 0.0 /100 | #339 | Tragic $74,815 |