Spanish American vs Immigrants from Bulgaria Householder Income Ages 45 - 64 years
COMPARE
Spanish American
Immigrants from Bulgaria
Householder Income Ages 45 - 64 years
Householder Income Ages 45 - 64 years Comparison
Spanish Americans
Immigrants from Bulgaria
$87,836
HOUSEHOLDER INCOME AGES 45 - 64 YEARS
0.2/ 100
METRIC RATING
269th/ 347
METRIC RANK
$109,379
HOUSEHOLDER INCOME AGES 45 - 64 YEARS
98.9/ 100
METRIC RATING
79th/ 347
METRIC RANK
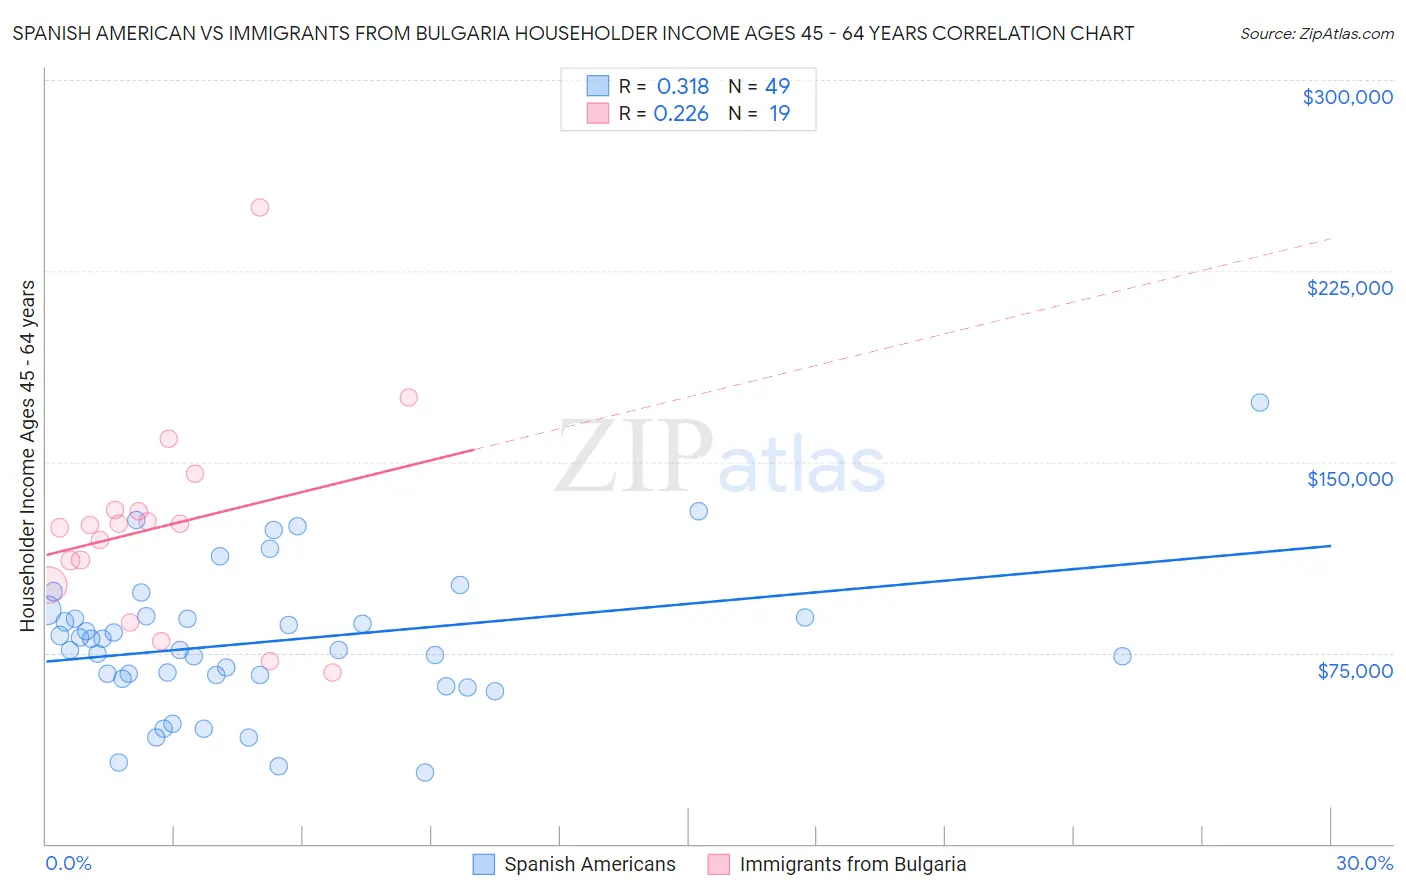
Spanish American vs Immigrants from Bulgaria Householder Income Ages 45 - 64 years Correlation Chart
The statistical analysis conducted on geographies consisting of 103,142,376 people shows a mild positive correlation between the proportion of Spanish Americans and household income with householder between the ages 45 and 64 in the United States with a correlation coefficient (R) of 0.318 and weighted average of $87,836. Similarly, the statistical analysis conducted on geographies consisting of 172,506,403 people shows a weak positive correlation between the proportion of Immigrants from Bulgaria and household income with householder between the ages 45 and 64 in the United States with a correlation coefficient (R) of 0.226 and weighted average of $109,379, a difference of 24.5%.
Householder Income Ages 45 - 64 years Correlation Summary
| Measurement | Spanish American | Immigrants from Bulgaria |
| Minimum | $28,021 | $67,188 |
| Maximum | $173,295 | $250,001 |
| Range | $145,274 | $182,813 |
| Mean | $79,401 | $124,619 |
| Median | $76,250 | $125,429 |
| Interquartile 25% (IQ1) | $65,439 | $101,725 |
| Interquartile 75% (IQ3) | $89,172 | $131,294 |
| Interquartile Range (IQR) | $23,734 | $29,569 |
| Standard Deviation (Sample) | $28,080 | $41,151 |
| Standard Deviation (Population) | $27,792 | $40,053 |
Similar Demographics by Householder Income Ages 45 - 64 years
Demographics Similar to Spanish Americans by Householder Income Ages 45 - 64 years
In terms of householder income ages 45 - 64 years, the demographic groups most similar to Spanish Americans are Immigrants from Micronesia ($87,864, a difference of 0.030%), Immigrants from Liberia ($87,739, a difference of 0.11%), Guatemalan ($87,705, a difference of 0.15%), Cape Verdean ($87,580, a difference of 0.29%), and Spanish American Indian ($87,561, a difference of 0.31%).
| Demographics | Rating | Rank | Householder Income Ages 45 - 64 years |
| Somalis | 0.3 /100 | #262 | Tragic $88,600 |
| Immigrants | Senegal | 0.3 /100 | #263 | Tragic $88,421 |
| Osage | 0.3 /100 | #264 | Tragic $88,390 |
| Jamaicans | 0.2 /100 | #265 | Tragic $88,327 |
| Immigrants | West Indies | 0.2 /100 | #266 | Tragic $88,164 |
| Hmong | 0.2 /100 | #267 | Tragic $88,115 |
| Immigrants | Micronesia | 0.2 /100 | #268 | Tragic $87,864 |
| Spanish Americans | 0.2 /100 | #269 | Tragic $87,836 |
| Immigrants | Liberia | 0.2 /100 | #270 | Tragic $87,739 |
| Guatemalans | 0.2 /100 | #271 | Tragic $87,705 |
| Cape Verdeans | 0.2 /100 | #272 | Tragic $87,580 |
| Spanish American Indians | 0.2 /100 | #273 | Tragic $87,561 |
| Iroquois | 0.1 /100 | #274 | Tragic $87,255 |
| Immigrants | Belize | 0.1 /100 | #275 | Tragic $87,229 |
| Immigrants | Latin America | 0.1 /100 | #276 | Tragic $87,219 |
Demographics Similar to Immigrants from Bulgaria by Householder Income Ages 45 - 64 years
In terms of householder income ages 45 - 64 years, the demographic groups most similar to Immigrants from Bulgaria are Jordanian ($109,376, a difference of 0.0%), Immigrants from Canada ($109,402, a difference of 0.020%), Immigrants from Eastern Europe ($109,335, a difference of 0.040%), Paraguayan ($109,447, a difference of 0.060%), and Immigrants from England ($109,446, a difference of 0.060%).
| Demographics | Rating | Rank | Householder Income Ages 45 - 64 years |
| Assyrians/Chaldeans/Syriacs | 99.3 /100 | #72 | Exceptional $110,201 |
| Argentineans | 99.3 /100 | #73 | Exceptional $110,103 |
| Immigrants | Egypt | 99.2 /100 | #74 | Exceptional $109,941 |
| South Africans | 99.1 /100 | #75 | Exceptional $109,719 |
| Paraguayans | 99.0 /100 | #76 | Exceptional $109,447 |
| Immigrants | England | 99.0 /100 | #77 | Exceptional $109,446 |
| Immigrants | Canada | 99.0 /100 | #78 | Exceptional $109,402 |
| Immigrants | Bulgaria | 98.9 /100 | #79 | Exceptional $109,379 |
| Jordanians | 98.9 /100 | #80 | Exceptional $109,376 |
| Immigrants | Eastern Europe | 98.9 /100 | #81 | Exceptional $109,335 |
| Immigrants | North America | 98.8 /100 | #82 | Exceptional $109,198 |
| Immigrants | Spain | 98.8 /100 | #83 | Exceptional $109,051 |
| Immigrants | Western Europe | 98.6 /100 | #84 | Exceptional $108,824 |
| Immigrants | Afghanistan | 98.6 /100 | #85 | Exceptional $108,785 |
| Austrians | 98.5 /100 | #86 | Exceptional $108,692 |