Immigrants from Guyana vs Black/African American Householder Income Ages 45 - 64 years
COMPARE
Immigrants from Guyana
Black/African American
Householder Income Ages 45 - 64 years
Householder Income Ages 45 - 64 years Comparison
Immigrants from Guyana
Blacks/African Americans
$90,186
HOUSEHOLDER INCOME AGES 45 - 64 YEARS
0.6/ 100
METRIC RATING
254th/ 347
METRIC RANK
$78,556
HOUSEHOLDER INCOME AGES 45 - 64 YEARS
0.0/ 100
METRIC RATING
332nd/ 347
METRIC RANK
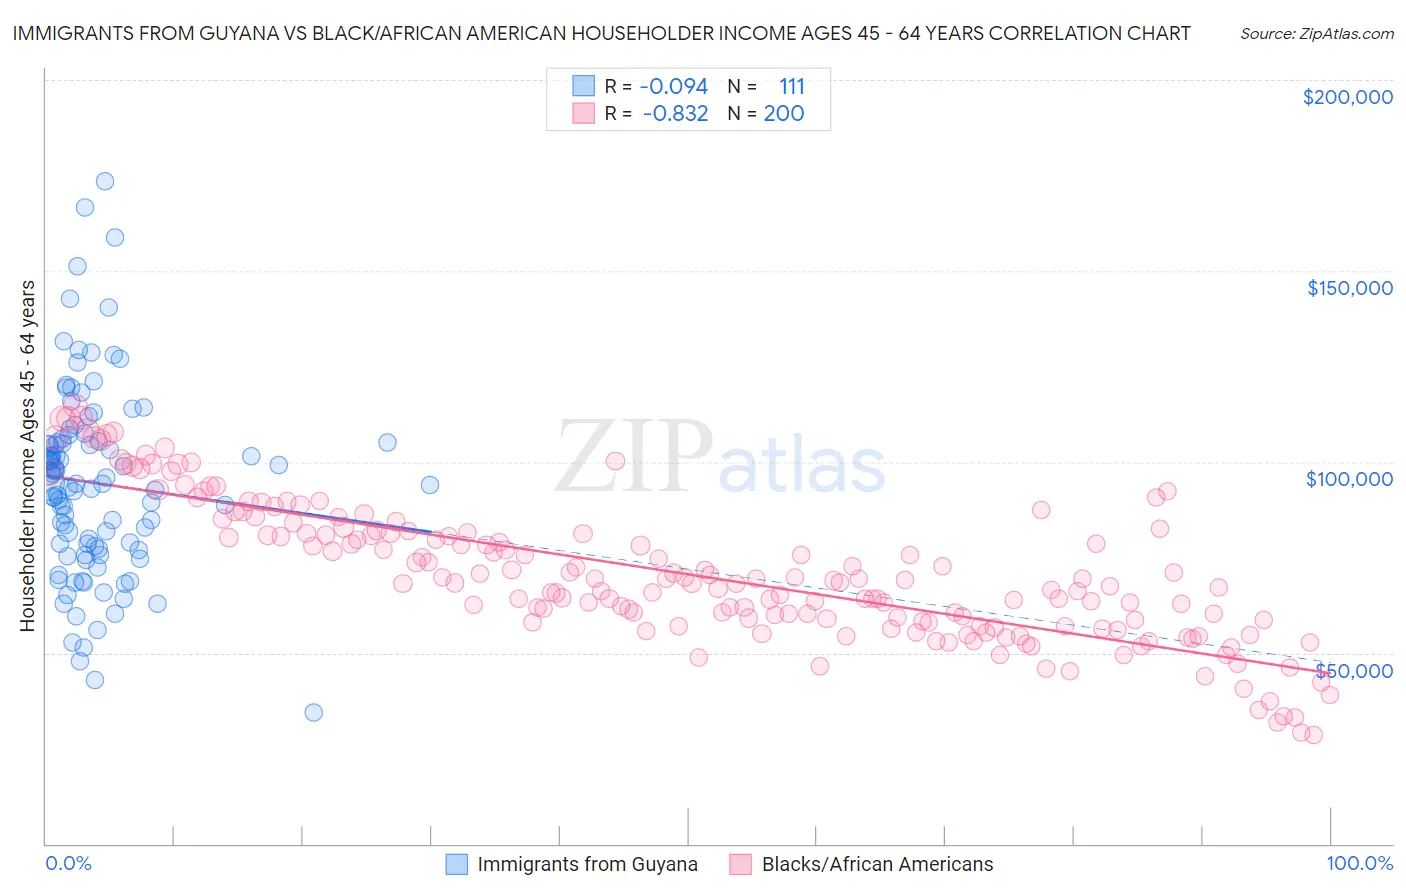
Immigrants from Guyana vs Black/African American Householder Income Ages 45 - 64 years Correlation Chart
The statistical analysis conducted on geographies consisting of 183,608,154 people shows a slight negative correlation between the proportion of Immigrants from Guyana and household income with householder between the ages 45 and 64 in the United States with a correlation coefficient (R) of -0.094 and weighted average of $90,186. Similarly, the statistical analysis conducted on geographies consisting of 562,323,408 people shows a very strong negative correlation between the proportion of Blacks/African Americans and household income with householder between the ages 45 and 64 in the United States with a correlation coefficient (R) of -0.832 and weighted average of $78,556, a difference of 14.8%.
Householder Income Ages 45 - 64 years Correlation Summary
| Measurement | Immigrants from Guyana | Black/African American |
| Minimum | $34,531 | $28,578 |
| Maximum | $173,438 | $114,640 |
| Range | $138,907 | $86,063 |
| Mean | $94,395 | $70,559 |
| Median | $94,422 | $68,403 |
| Interquartile 25% (IQ1) | $77,393 | $58,195 |
| Interquartile 75% (IQ3) | $105,417 | $81,447 |
| Interquartile Range (IQR) | $28,024 | $23,253 |
| Standard Deviation (Sample) | $24,856 | $18,044 |
| Standard Deviation (Population) | $24,743 | $17,998 |
Similar Demographics by Householder Income Ages 45 - 64 years
Demographics Similar to Immigrants from Guyana by Householder Income Ages 45 - 64 years
In terms of householder income ages 45 - 64 years, the demographic groups most similar to Immigrants from Guyana are Barbadian ($90,266, a difference of 0.090%), Marshallese ($90,455, a difference of 0.30%), West Indian ($89,906, a difference of 0.31%), American ($90,536, a difference of 0.39%), and French American Indian ($89,811, a difference of 0.42%).
| Demographics | Rating | Rank | Householder Income Ages 45 - 64 years |
| Alaskan Athabascans | 0.9 /100 | #247 | Tragic $90,951 |
| Immigrants | Laos | 0.9 /100 | #248 | Tragic $90,909 |
| Mexican American Indians | 0.8 /100 | #249 | Tragic $90,811 |
| Sub-Saharan Africans | 0.8 /100 | #250 | Tragic $90,691 |
| Americans | 0.7 /100 | #251 | Tragic $90,536 |
| Marshallese | 0.7 /100 | #252 | Tragic $90,455 |
| Barbadians | 0.6 /100 | #253 | Tragic $90,266 |
| Immigrants | Guyana | 0.6 /100 | #254 | Tragic $90,186 |
| West Indians | 0.5 /100 | #255 | Tragic $89,906 |
| French American Indians | 0.5 /100 | #256 | Tragic $89,811 |
| German Russians | 0.4 /100 | #257 | Tragic $89,398 |
| Immigrants | Barbados | 0.4 /100 | #258 | Tragic $89,394 |
| Immigrants | Nicaragua | 0.4 /100 | #259 | Tragic $89,108 |
| Liberians | 0.3 /100 | #260 | Tragic $88,929 |
| Belizeans | 0.3 /100 | #261 | Tragic $88,684 |
Demographics Similar to Blacks/African Americans by Householder Income Ages 45 - 64 years
In terms of householder income ages 45 - 64 years, the demographic groups most similar to Blacks/African Americans are Immigrants from Dominican Republic ($78,836, a difference of 0.36%), Creek ($78,960, a difference of 0.51%), Dutch West Indian ($79,171, a difference of 0.78%), Immigrants from Congo ($77,850, a difference of 0.91%), and Native/Alaskan ($79,816, a difference of 1.6%).
| Demographics | Rating | Rank | Householder Income Ages 45 - 64 years |
| Immigrants | Cuba | 0.0 /100 | #325 | Tragic $80,662 |
| Dominicans | 0.0 /100 | #326 | Tragic $80,623 |
| Seminole | 0.0 /100 | #327 | Tragic $80,077 |
| Natives/Alaskans | 0.0 /100 | #328 | Tragic $79,816 |
| Dutch West Indians | 0.0 /100 | #329 | Tragic $79,171 |
| Creek | 0.0 /100 | #330 | Tragic $78,960 |
| Immigrants | Dominican Republic | 0.0 /100 | #331 | Tragic $78,836 |
| Blacks/African Americans | 0.0 /100 | #332 | Tragic $78,556 |
| Immigrants | Congo | 0.0 /100 | #333 | Tragic $77,850 |
| Menominee | 0.0 /100 | #334 | Tragic $76,903 |
| Cheyenne | 0.0 /100 | #335 | Tragic $76,362 |
| Arapaho | 0.0 /100 | #336 | Tragic $75,945 |
| Pueblo | 0.0 /100 | #337 | Tragic $75,601 |
| Hopi | 0.0 /100 | #338 | Tragic $75,562 |
| Kiowa | 0.0 /100 | #339 | Tragic $74,815 |