Cypriot vs Black/African American Householder Income Ages 45 - 64 years
COMPARE
Cypriot
Black/African American
Householder Income Ages 45 - 64 years
Householder Income Ages 45 - 64 years Comparison
Cypriots
Blacks/African Americans
$123,396
HOUSEHOLDER INCOME AGES 45 - 64 YEARS
100.0/ 100
METRIC RATING
11th/ 347
METRIC RANK
$78,556
HOUSEHOLDER INCOME AGES 45 - 64 YEARS
0.0/ 100
METRIC RATING
332nd/ 347
METRIC RANK
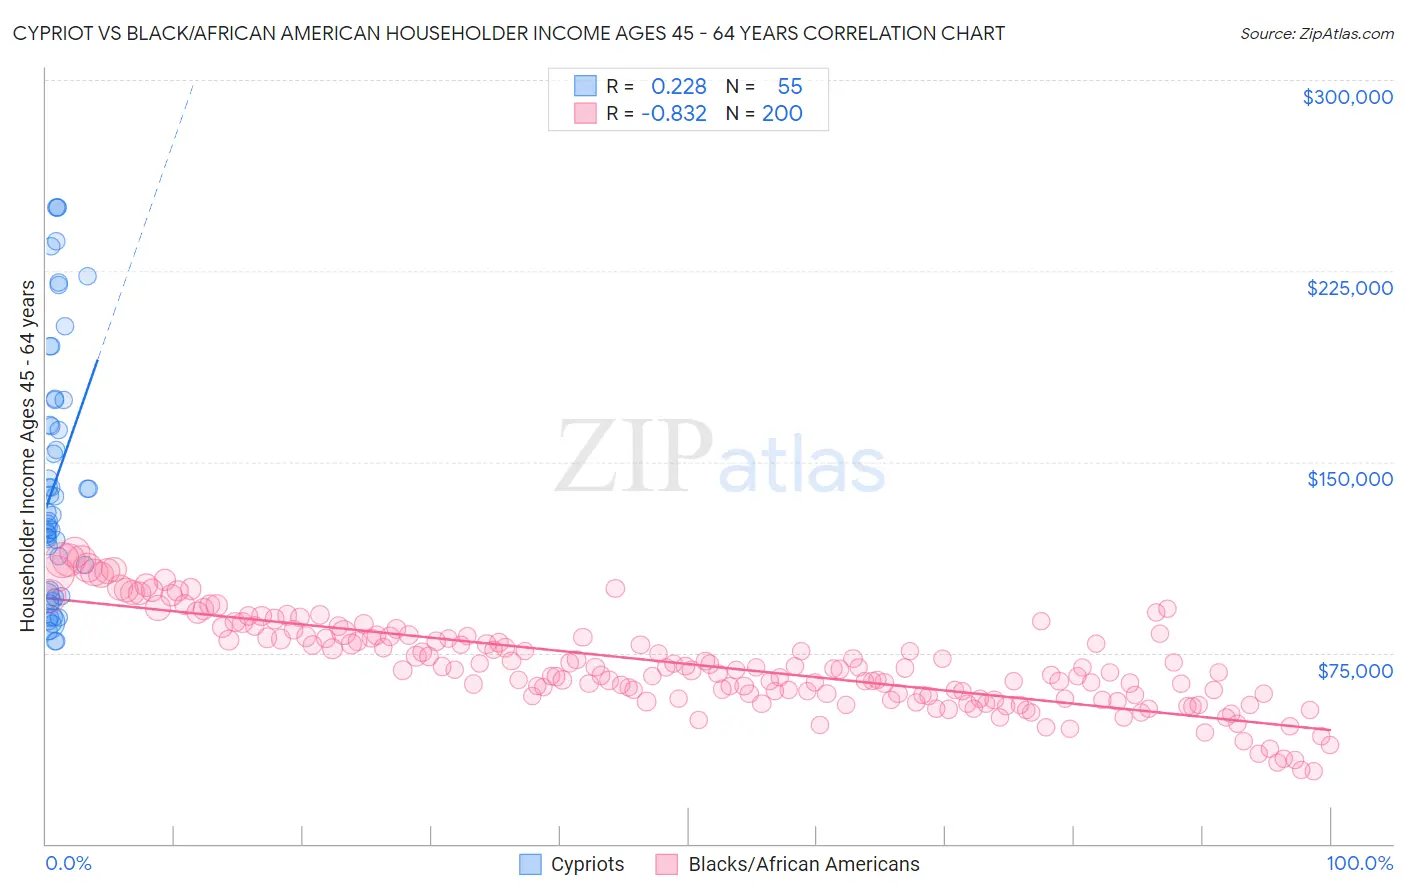
Cypriot vs Black/African American Householder Income Ages 45 - 64 years Correlation Chart
The statistical analysis conducted on geographies consisting of 61,824,510 people shows a weak positive correlation between the proportion of Cypriots and household income with householder between the ages 45 and 64 in the United States with a correlation coefficient (R) of 0.228 and weighted average of $123,396. Similarly, the statistical analysis conducted on geographies consisting of 562,323,408 people shows a very strong negative correlation between the proportion of Blacks/African Americans and household income with householder between the ages 45 and 64 in the United States with a correlation coefficient (R) of -0.832 and weighted average of $78,556, a difference of 57.1%.
Householder Income Ages 45 - 64 years Correlation Summary
| Measurement | Cypriot | Black/African American |
| Minimum | $79,338 | $28,578 |
| Maximum | $250,001 | $114,640 |
| Range | $170,663 | $86,063 |
| Mean | $142,303 | $70,559 |
| Median | $128,945 | $68,403 |
| Interquartile 25% (IQ1) | $97,356 | $58,195 |
| Interquartile 75% (IQ3) | $174,242 | $81,447 |
| Interquartile Range (IQR) | $76,886 | $23,253 |
| Standard Deviation (Sample) | $49,631 | $18,044 |
| Standard Deviation (Population) | $49,178 | $17,998 |
Similar Demographics by Householder Income Ages 45 - 64 years
Demographics Similar to Cypriots by Householder Income Ages 45 - 64 years
In terms of householder income ages 45 - 64 years, the demographic groups most similar to Cypriots are Immigrants from Israel ($122,893, a difference of 0.41%), Immigrants from Ireland ($122,757, a difference of 0.52%), Immigrants from South Central Asia ($124,188, a difference of 0.64%), Indian (Asian) ($122,343, a difference of 0.86%), and Immigrants from Eastern Asia ($122,222, a difference of 0.96%).
| Demographics | Rating | Rank | Householder Income Ages 45 - 64 years |
| Thais | 100.0 /100 | #4 | Exceptional $129,560 |
| Immigrants | Singapore | 100.0 /100 | #5 | Exceptional $129,514 |
| Iranians | 100.0 /100 | #6 | Exceptional $129,350 |
| Immigrants | Hong Kong | 100.0 /100 | #7 | Exceptional $127,500 |
| Immigrants | Iran | 100.0 /100 | #8 | Exceptional $126,940 |
| Okinawans | 100.0 /100 | #9 | Exceptional $124,796 |
| Immigrants | South Central Asia | 100.0 /100 | #10 | Exceptional $124,188 |
| Cypriots | 100.0 /100 | #11 | Exceptional $123,396 |
| Immigrants | Israel | 100.0 /100 | #12 | Exceptional $122,893 |
| Immigrants | Ireland | 100.0 /100 | #13 | Exceptional $122,757 |
| Indians (Asian) | 100.0 /100 | #14 | Exceptional $122,343 |
| Immigrants | Eastern Asia | 100.0 /100 | #15 | Exceptional $122,222 |
| Immigrants | China | 100.0 /100 | #16 | Exceptional $122,178 |
| Burmese | 100.0 /100 | #17 | Exceptional $121,444 |
| Immigrants | Korea | 100.0 /100 | #18 | Exceptional $121,243 |
Demographics Similar to Blacks/African Americans by Householder Income Ages 45 - 64 years
In terms of householder income ages 45 - 64 years, the demographic groups most similar to Blacks/African Americans are Immigrants from Dominican Republic ($78,836, a difference of 0.36%), Creek ($78,960, a difference of 0.51%), Dutch West Indian ($79,171, a difference of 0.78%), Immigrants from Congo ($77,850, a difference of 0.91%), and Native/Alaskan ($79,816, a difference of 1.6%).
| Demographics | Rating | Rank | Householder Income Ages 45 - 64 years |
| Immigrants | Cuba | 0.0 /100 | #325 | Tragic $80,662 |
| Dominicans | 0.0 /100 | #326 | Tragic $80,623 |
| Seminole | 0.0 /100 | #327 | Tragic $80,077 |
| Natives/Alaskans | 0.0 /100 | #328 | Tragic $79,816 |
| Dutch West Indians | 0.0 /100 | #329 | Tragic $79,171 |
| Creek | 0.0 /100 | #330 | Tragic $78,960 |
| Immigrants | Dominican Republic | 0.0 /100 | #331 | Tragic $78,836 |
| Blacks/African Americans | 0.0 /100 | #332 | Tragic $78,556 |
| Immigrants | Congo | 0.0 /100 | #333 | Tragic $77,850 |
| Menominee | 0.0 /100 | #334 | Tragic $76,903 |
| Cheyenne | 0.0 /100 | #335 | Tragic $76,362 |
| Arapaho | 0.0 /100 | #336 | Tragic $75,945 |
| Pueblo | 0.0 /100 | #337 | Tragic $75,601 |
| Hopi | 0.0 /100 | #338 | Tragic $75,562 |
| Kiowa | 0.0 /100 | #339 | Tragic $74,815 |