Spanish American vs Black/African American Householder Income Over 65 years
COMPARE
Spanish American
Black/African American
Householder Income Over 65 years
Householder Income Over 65 years Comparison
Spanish Americans
Blacks/African Americans
$57,021
HOUSEHOLDER INCOME OVER 65 YEARS
1.6/ 100
METRIC RATING
235th/ 347
METRIC RANK
$50,779
HOUSEHOLDER INCOME OVER 65 YEARS
0.0/ 100
METRIC RATING
329th/ 347
METRIC RANK
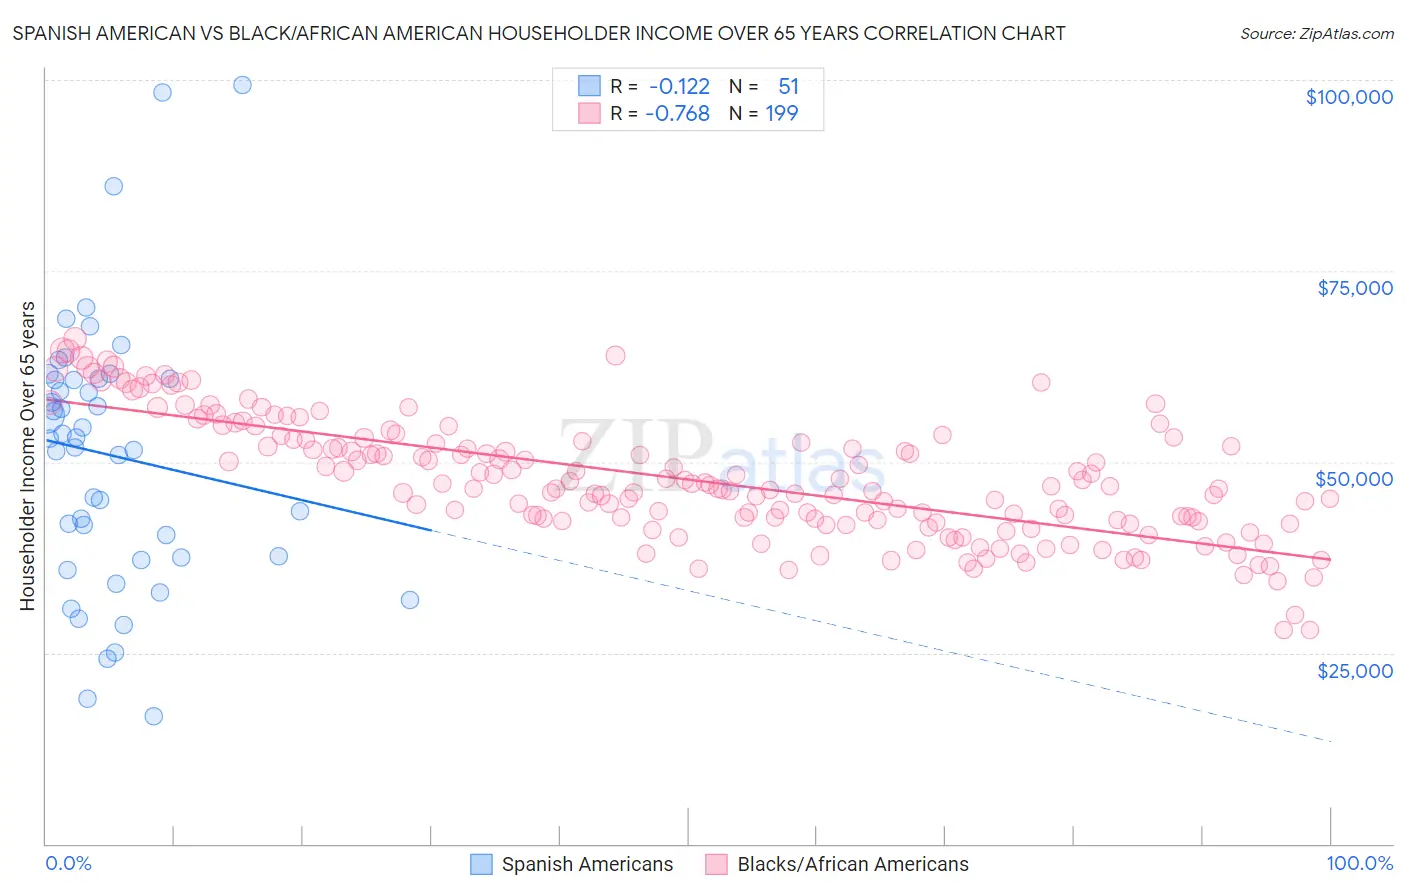
Spanish American vs Black/African American Householder Income Over 65 years Correlation Chart
The statistical analysis conducted on geographies consisting of 103,119,527 people shows a poor negative correlation between the proportion of Spanish Americans and household income with householder over the age of 65 in the United States with a correlation coefficient (R) of -0.122 and weighted average of $57,021. Similarly, the statistical analysis conducted on geographies consisting of 560,756,533 people shows a strong negative correlation between the proportion of Blacks/African Americans and household income with householder over the age of 65 in the United States with a correlation coefficient (R) of -0.768 and weighted average of $50,779, a difference of 12.3%.
Householder Income Over 65 years Correlation Summary
| Measurement | Spanish American | Black/African American |
| Minimum | $16,667 | $27,967 |
| Maximum | $99,316 | $66,084 |
| Range | $82,649 | $38,117 |
| Mean | $50,862 | $47,714 |
| Median | $53,029 | $46,741 |
| Interquartile 25% (IQ1) | $37,400 | $42,258 |
| Interquartile 75% (IQ3) | $60,833 | $52,943 |
| Interquartile Range (IQR) | $23,433 | $10,685 |
| Standard Deviation (Sample) | $17,582 | $7,891 |
| Standard Deviation (Population) | $17,409 | $7,872 |
Similar Demographics by Householder Income Over 65 years
Demographics Similar to Spanish Americans by Householder Income Over 65 years
In terms of householder income over 65 years, the demographic groups most similar to Spanish Americans are Immigrants from Uruguay ($56,975, a difference of 0.080%), Immigrants from Panama ($56,944, a difference of 0.14%), Immigrants from Burma/Myanmar ($57,114, a difference of 0.16%), Immigrants from Western Africa ($57,119, a difference of 0.17%), and Fijian ($56,768, a difference of 0.45%).
| Demographics | Rating | Rank | Householder Income Over 65 years |
| Immigrants | Albania | 3.6 /100 | #228 | Tragic $57,828 |
| Immigrants | Colombia | 3.0 /100 | #229 | Tragic $57,658 |
| Immigrants | Cambodia | 2.8 /100 | #230 | Tragic $57,580 |
| Immigrants | Nonimmigrants | 2.4 /100 | #231 | Tragic $57,426 |
| Immigrants | Venezuela | 2.3 /100 | #232 | Tragic $57,371 |
| Immigrants | Western Africa | 1.7 /100 | #233 | Tragic $57,119 |
| Immigrants | Burma/Myanmar | 1.7 /100 | #234 | Tragic $57,114 |
| Spanish Americans | 1.6 /100 | #235 | Tragic $57,021 |
| Immigrants | Uruguay | 1.5 /100 | #236 | Tragic $56,975 |
| Immigrants | Panama | 1.5 /100 | #237 | Tragic $56,944 |
| Fijians | 1.2 /100 | #238 | Tragic $56,768 |
| Immigrants | Laos | 1.2 /100 | #239 | Tragic $56,722 |
| Sub-Saharan Africans | 1.0 /100 | #240 | Tragic $56,615 |
| Immigrants | Guyana | 0.9 /100 | #241 | Tragic $56,495 |
| Yaqui | 0.8 /100 | #242 | Tragic $56,417 |
Demographics Similar to Blacks/African Americans by Householder Income Over 65 years
In terms of householder income over 65 years, the demographic groups most similar to Blacks/African Americans are Immigrants from Grenada ($50,747, a difference of 0.060%), Hopi ($50,925, a difference of 0.29%), Bahamian ($51,000, a difference of 0.44%), Pima ($50,539, a difference of 0.47%), and Dutch West Indian ($50,475, a difference of 0.60%).
| Demographics | Rating | Rank | Householder Income Over 65 years |
| British West Indians | 0.0 /100 | #322 | Tragic $51,463 |
| Cajuns | 0.0 /100 | #323 | Tragic $51,397 |
| Immigrants | Congo | 0.0 /100 | #324 | Tragic $51,393 |
| Immigrants | Haiti | 0.0 /100 | #325 | Tragic $51,219 |
| Kiowa | 0.0 /100 | #326 | Tragic $51,140 |
| Bahamians | 0.0 /100 | #327 | Tragic $51,000 |
| Hopi | 0.0 /100 | #328 | Tragic $50,925 |
| Blacks/African Americans | 0.0 /100 | #329 | Tragic $50,779 |
| Immigrants | Grenada | 0.0 /100 | #330 | Tragic $50,747 |
| Pima | 0.0 /100 | #331 | Tragic $50,539 |
| Dutch West Indians | 0.0 /100 | #332 | Tragic $50,475 |
| Cape Verdeans | 0.0 /100 | #333 | Tragic $50,077 |
| Immigrants | Dominica | 0.0 /100 | #334 | Tragic $50,071 |
| Crow | 0.0 /100 | #335 | Tragic $49,234 |
| Cubans | 0.0 /100 | #336 | Tragic $49,152 |