Native Hawaiian vs Black/African American Householder Income Ages 45 - 64 years

COMPARE

Native Hawaiian
Race
Ancestry
AfghanAfricanAlaska NativeAlaskan AthabascanAlbanianAleutAlsatianAmericanApacheArabArapahoArgentineanArmenianAssyrian/Chaldean/SyriacAustralianAustrianBahamianBangladeshiBarbadianBasqueBelgianBelizeanBermudanBhutaneseBlackfeetBolivianBrazilianBritishBritish West IndianBulgarianBurmeseCajunCambodianCanadianCape VerdeanCarpatho RusynCelticCentral AmericanCentral American IndianCherokeeCheyenneChickasawChileanChineseChippewaChoctawColombianColvilleComancheCosta RicanCreeCreekCroatianCrowCubanCypriotCzechCzechoslovakianDanishDelawareDominicanDutchDutch West IndianEastern EuropeanEcuadorianEgyptianEnglishEstonianEthiopianEuropeanFijianFilipinoFinnishFrenchFrench American IndianFrench CanadianGermanGerman RussianGhanaianGreekGuamanian/ChamorroGuatemalanGuyaneseHaitianHmongHonduranHopiHoumaHungarianIcelanderIndian (Asian)IndonesianInupiatIranianIraqiIrishIroquoisIsraeliItalianJamaicanJapaneseJordanianKenyanKiowaKoreanLaotianLatvianLebaneseLiberianLithuanianLumbeeLuxembourgerMacedonianMalaysianMalteseMarshalleseMenomineeMexicanMexican American IndianMongolianMoroccanNative HawaiianNavajoNepaleseNew ZealanderNicaraguanNigerianNorthern EuropeanNorwegianOkinawanOsageOttawaPaiutePakistaniPalestinianPanamanianParaguayanPennsylvania GermanPeruvianPimaPolishPortuguesePotawatomiPuebloPuerto RicanPuget Sound SalishRomanianRussianSalvadoranSamoanScandinavianScotch-IrishScottishSeminoleSenegaleseSerbianShoshoneSierra LeoneanSiouxSlavicSlovakSloveneSomaliSouth AfricanSouth AmericanSouth American IndianSoviet UnionSpaniardSpanishSpanish AmericanSpanish American IndianSri LankanSubsaharan AfricanSudaneseSwedishSwissSyrianTaiwaneseThaiTlingit-HaidaTohono O'OdhamTonganTrinidadian and TobagonianTsimshianTurkishU.S. Virgin IslanderUgandanUkrainianUruguayanUteVenezuelanVietnameseWelshWest IndianYakamaYaquiYugoslavianYumanYup'ikZimbabwean
Immigration
NonimmigrantsImmigrantsAfghanistanAfricaAlbaniaArgentinaArmeniaAsiaAustraliaAustriaBahamasBangladeshBarbadosBelarusBelgiumBelizeBoliviaBosnia and HerzegovinaBrazilBulgariaBurma/MyanmarCabo VerdeCambodiaCameroonCanadaCaribbeanCentral AmericaChileChinaColombiaCongoCosta RicaCroatiaCubaCzechoslovakiaDenmarkDominicaDominican RepublicEastern AfricaEastern AsiaEastern EuropeEcuadorEgyptEl SalvadorEnglandEritreaEthiopiaEuropeFijiFranceGermanyGhanaGreeceGrenadaGuatemalaGuyanaHaitiHondurasHong KongHungaryIndiaIndonesiaIranIraqIrelandIsraelItalyJamaicaJapanJordanKazakhstanKenyaKoreaKuwaitLaosLatin AmericaLatviaLebanonLiberiaLithuaniaMalaysiaMexicoMicronesiaMiddle AfricaMoldovaMoroccoNepalNetherlandsNicaraguaNigeriaNorth AmericaNorth MacedoniaNorthern AfricaNorthern EuropeNorwayOceaniaPakistanPanamaPeruPhilippinesPolandPortugalRomaniaRussiaSaudi ArabiaScotlandSenegalSerbiaSierra LeoneSingaporeSomaliaSouth AfricaSouth AmericaSouth Central AsiaSouth Eastern AsiaSouthern EuropeSpainSri LankaSt. Vincent and the GrenadinesSudanSwedenSwitzerlandSyriaTaiwanThailandTrinidad and TobagoTurkeyUgandaUkraineUruguayUzbekistanVenezuelaVietnamWest IndiesWestern AfricaWestern AsiaWestern EuropeYemenZaireZimbabweAzores
Black/African American
Race
Ancestry
AfghanAfricanAlaska NativeAlaskan AthabascanAlbanianAleutAlsatianAmericanApacheArabArapahoArgentineanArmenianAssyrian/Chaldean/SyriacAustralianAustrianBahamianBangladeshiBarbadianBasqueBelgianBelizeanBermudanBhutaneseBlackfeetBolivianBrazilianBritishBritish West IndianBulgarianBurmeseCajunCambodianCanadianCape VerdeanCarpatho RusynCelticCentral AmericanCentral American IndianCherokeeCheyenneChickasawChileanChineseChippewaChoctawColombianColvilleComancheCosta RicanCreeCreekCroatianCrowCubanCypriotCzechCzechoslovakianDanishDelawareDominicanDutchDutch West IndianEastern EuropeanEcuadorianEgyptianEnglishEstonianEthiopianEuropeanFijianFilipinoFinnishFrenchFrench American IndianFrench CanadianGermanGerman RussianGhanaianGreekGuamanian/ChamorroGuatemalanGuyaneseHaitianHmongHonduranHopiHoumaHungarianIcelanderIndian (Asian)IndonesianInupiatIranianIraqiIrishIroquoisIsraeliItalianJamaicanJapaneseJordanianKenyanKiowaKoreanLaotianLatvianLebaneseLiberianLithuanianLumbeeLuxembourgerMacedonianMalaysianMalteseMarshalleseMenomineeMexicanMexican American IndianMongolianMoroccanNavajoNepaleseNew ZealanderNicaraguanNigerianNorthern EuropeanNorwegianOkinawanOsageOttawaPaiutePakistaniPalestinianPanamanianParaguayanPennsylvania GermanPeruvianPimaPolishPortuguesePotawatomiPuebloPuerto RicanPuget Sound SalishRomanianRussianSalvadoranSamoanScandinavianScotch-IrishScottishSeminoleSenegaleseSerbianShoshoneSierra LeoneanSiouxSlavicSlovakSloveneSomaliSouth AfricanSouth AmericanSouth American IndianSoviet UnionSpaniardSpanishSpanish AmericanSpanish American IndianSri LankanSubsaharan AfricanSudaneseSwedishSwissSyrianTaiwaneseThaiTlingit-HaidaTohono O'OdhamTonganTrinidadian and TobagonianTsimshianTurkishU.S. Virgin IslanderUgandanUkrainianUruguayanUteVenezuelanVietnameseWelshWest IndianYakamaYaquiYugoslavianYumanYup'ikZimbabwean
Immigration
NonimmigrantsImmigrantsAfghanistanAfricaAlbaniaArgentinaArmeniaAsiaAustraliaAustriaBahamasBangladeshBarbadosBelarusBelgiumBelizeBoliviaBosnia and HerzegovinaBrazilBulgariaBurma/MyanmarCabo VerdeCambodiaCameroonCanadaCaribbeanCentral AmericaChileChinaColombiaCongoCosta RicaCroatiaCubaCzechoslovakiaDenmarkDominicaDominican RepublicEastern AfricaEastern AsiaEastern EuropeEcuadorEgyptEl SalvadorEnglandEritreaEthiopiaEuropeFijiFranceGermanyGhanaGreeceGrenadaGuatemalaGuyanaHaitiHondurasHong KongHungaryIndiaIndonesiaIranIraqIrelandIsraelItalyJamaicaJapanJordanKazakhstanKenyaKoreaKuwaitLaosLatin AmericaLatviaLebanonLiberiaLithuaniaMalaysiaMexicoMicronesiaMiddle AfricaMoldovaMoroccoNepalNetherlandsNicaraguaNigeriaNorth AmericaNorth MacedoniaNorthern AfricaNorthern EuropeNorwayOceaniaPakistanPanamaPeruPhilippinesPolandPortugalRomaniaRussiaSaudi ArabiaScotlandSenegalSerbiaSierra LeoneSingaporeSomaliaSouth AfricaSouth AmericaSouth Central AsiaSouth Eastern AsiaSouthern EuropeSpainSri LankaSt. Vincent and the GrenadinesSudanSwedenSwitzerlandSyriaTaiwanThailandTrinidad and TobagoTurkeyUgandaUkraineUruguayUzbekistanVenezuelaVietnamWest IndiesWestern AfricaWestern AsiaWestern EuropeYemenZaireZimbabweAzores
Householder Income Ages 45 - 64 years
Income
Poverty
Unemployment
Labor Participation
Family Structure
Vehicle Availability
Education Level
Disability

Householder Income Ages 45 - 64 years Comparison

Native Hawaiians

Blacks/African Americans

Exceptional
Tragic
$105,149
HOUSEHOLDER INCOME AGES 45 - 64 YEARS
91.8/ 100
METRIC RATING
128th/ 347
METRIC RANK
$78,556
HOUSEHOLDER INCOME AGES 45 - 64 YEARS
0.0/ 100
METRIC RATING
332nd/ 347
METRIC RANK

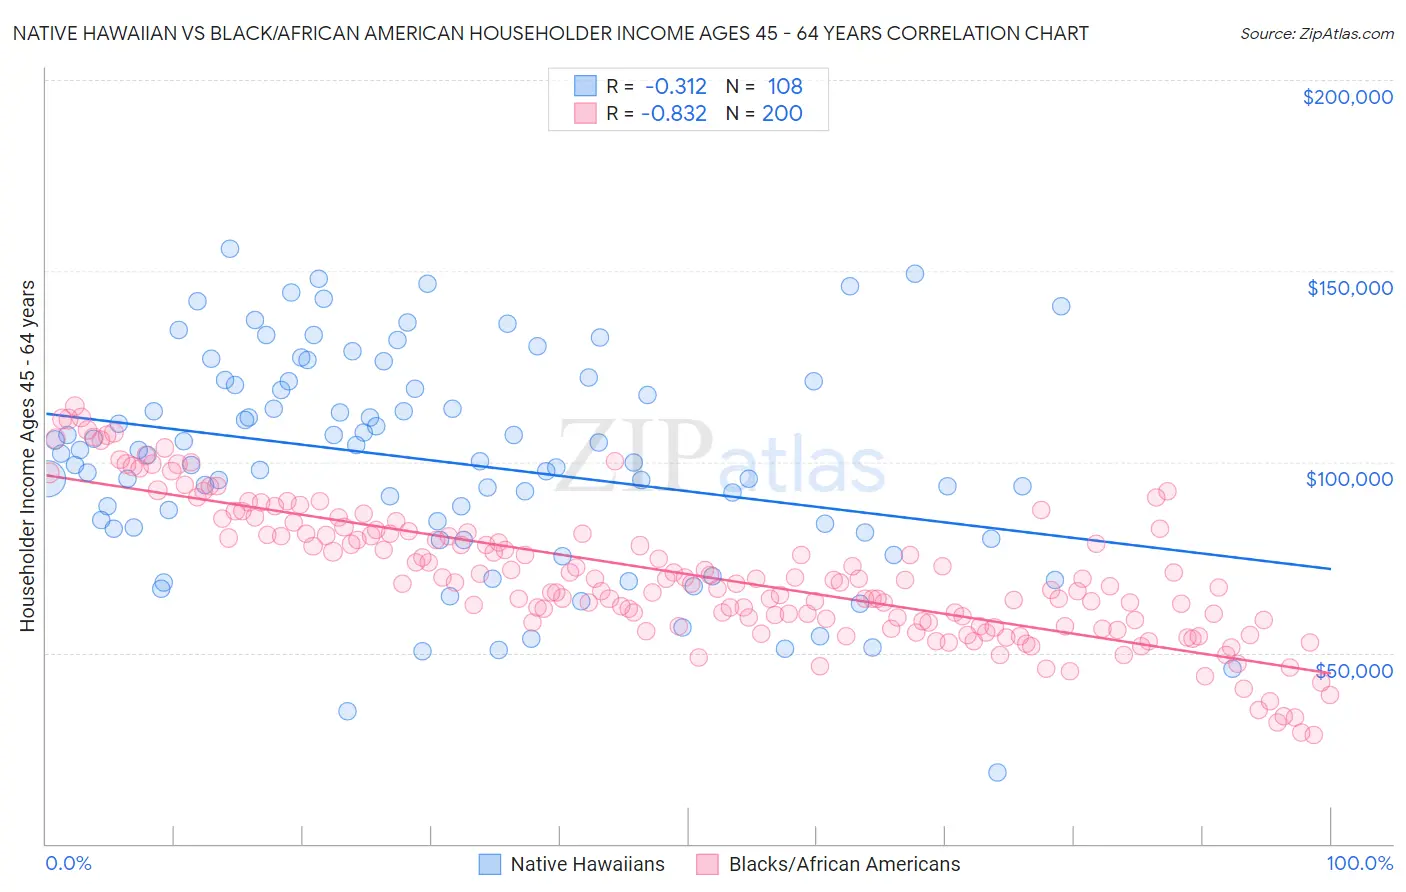
Native Hawaiian vs Black/African American Householder Income Ages 45 - 64 years Correlation Chart

The statistical analysis conducted on geographies consisting of 331,465,434 people shows a mild negative correlation between the proportion of Native Hawaiians and household income with householder between the ages 45 and 64 in the United States with a correlation coefficient (R) of -0.312 and weighted average of $105,149. Similarly, the statistical analysis conducted on geographies consisting of 562,323,408 people shows a very strong negative correlation between the proportion of Blacks/African Americans and household income with householder between the ages 45 and 64 in the United States with a correlation coefficient (R) of -0.832 and weighted average of $78,556, a difference of 33.9%.
Native Hawaiian vs Black/African American Householder Income Ages 45 - 64 years

Householder Income Ages 45 - 64 years Correlation Summary

MeasurementNative HawaiianBlack/African American
Minimum$18,640$28,578
Maximum$155,705$114,640
Range$137,065$86,063
Mean$100,121$70,559
Median$101,051$68,403
Interquartile 25% (IQ1)$82,658$58,195
Interquartile 75% (IQ3)$120,563$81,447
Interquartile Range (IQR)$37,905$23,253
Standard Deviation (Sample)$28,044$18,044
Standard Deviation (Population)$27,914$17,998

Similar Demographics by Householder Income Ages 45 - 64 years

Demographics Similar to Native Hawaiians by Householder Income Ages 45 - 64 years

In terms of householder income ages 45 - 64 years, the demographic groups most similar to Native Hawaiians are Peruvian ($105,070, a difference of 0.080%), Immigrants from Saudi Arabia ($105,249, a difference of 0.090%), Portuguese ($105,309, a difference of 0.15%), Immigrants from Zimbabwe ($104,992, a difference of 0.15%), and Pakistani ($105,317, a difference of 0.16%).
DemographicsRating | RankHouseholder Income Ages 45 - 64 years
Poles
94.4
/100
|
#121
Exceptional
$105,952
Immigrants | North Macedonia
94.2
/100
|
#122
Exceptional
$105,892
Danes
93.4
/100
|
#123
Exceptional
$105,619
Immigrants | Northern Africa
92.8
/100
|
#124
Exceptional
$105,430
Pakistanis
92.4
/100
|
#125
Exceptional
$105,317
Portuguese
92.4
/100
|
#126
Exceptional
$105,309
Immigrants | Saudi Arabia
92.2
/100
|
#127
Exceptional
$105,249
Native Hawaiians
91.8
/100
|
#128
Exceptional
$105,149
Peruvians
91.5
/100
|
#129
Exceptional
$105,070
Immigrants | Zimbabwe
91.2
/100
|
#130
Exceptional
$104,992
Immigrants | Syria
90.7
/100
|
#131
Exceptional
$104,858
Lebanese
90.1
/100
|
#132
Exceptional
$104,734
Arabs
89.3
/100
|
#133
Excellent
$104,566
Canadians
89.3
/100
|
#134
Excellent
$104,560
Brazilians
88.6
/100
|
#135
Excellent
$104,408

Demographics Similar to Blacks/African Americans by Householder Income Ages 45 - 64 years

In terms of householder income ages 45 - 64 years, the demographic groups most similar to Blacks/African Americans are Immigrants from Dominican Republic ($78,836, a difference of 0.36%), Creek ($78,960, a difference of 0.51%), Dutch West Indian ($79,171, a difference of 0.78%), Immigrants from Congo ($77,850, a difference of 0.91%), and Native/Alaskan ($79,816, a difference of 1.6%).
DemographicsRating | RankHouseholder Income Ages 45 - 64 years
Immigrants | Cuba
0.0
/100
|
#325
Tragic
$80,662
Dominicans
0.0
/100
|
#326
Tragic
$80,623
Seminole
0.0
/100
|
#327
Tragic
$80,077
Natives/Alaskans
0.0
/100
|
#328
Tragic
$79,816
Dutch West Indians
0.0
/100
|
#329
Tragic
$79,171
Creek
0.0
/100
|
#330
Tragic
$78,960
Immigrants | Dominican Republic
0.0
/100
|
#331
Tragic
$78,836
Blacks/African Americans
0.0
/100
|
#332
Tragic
$78,556
Immigrants | Congo
0.0
/100
|
#333
Tragic
$77,850
Menominee
0.0
/100
|
#334
Tragic
$76,903
Cheyenne
0.0
/100
|
#335
Tragic
$76,362
Arapaho
0.0
/100
|
#336
Tragic
$75,945
Pueblo
0.0
/100
|
#337
Tragic
$75,601
Hopi
0.0
/100
|
#338
Tragic
$75,562
Kiowa
0.0
/100
|
#339
Tragic
$74,815