Spanish American vs Black/African American Disability Age Over 75
COMPARE
Spanish American
Black/African American
Disability Age Over 75
Disability Age Over 75 Comparison
Spanish Americans
Blacks/African Americans
50.0%
DISABILITY AGE OVER 75
0.0/ 100
METRIC RATING
295th/ 347
METRIC RANK
49.5%
DISABILITY AGE OVER 75
0.0/ 100
METRIC RATING
282nd/ 347
METRIC RANK
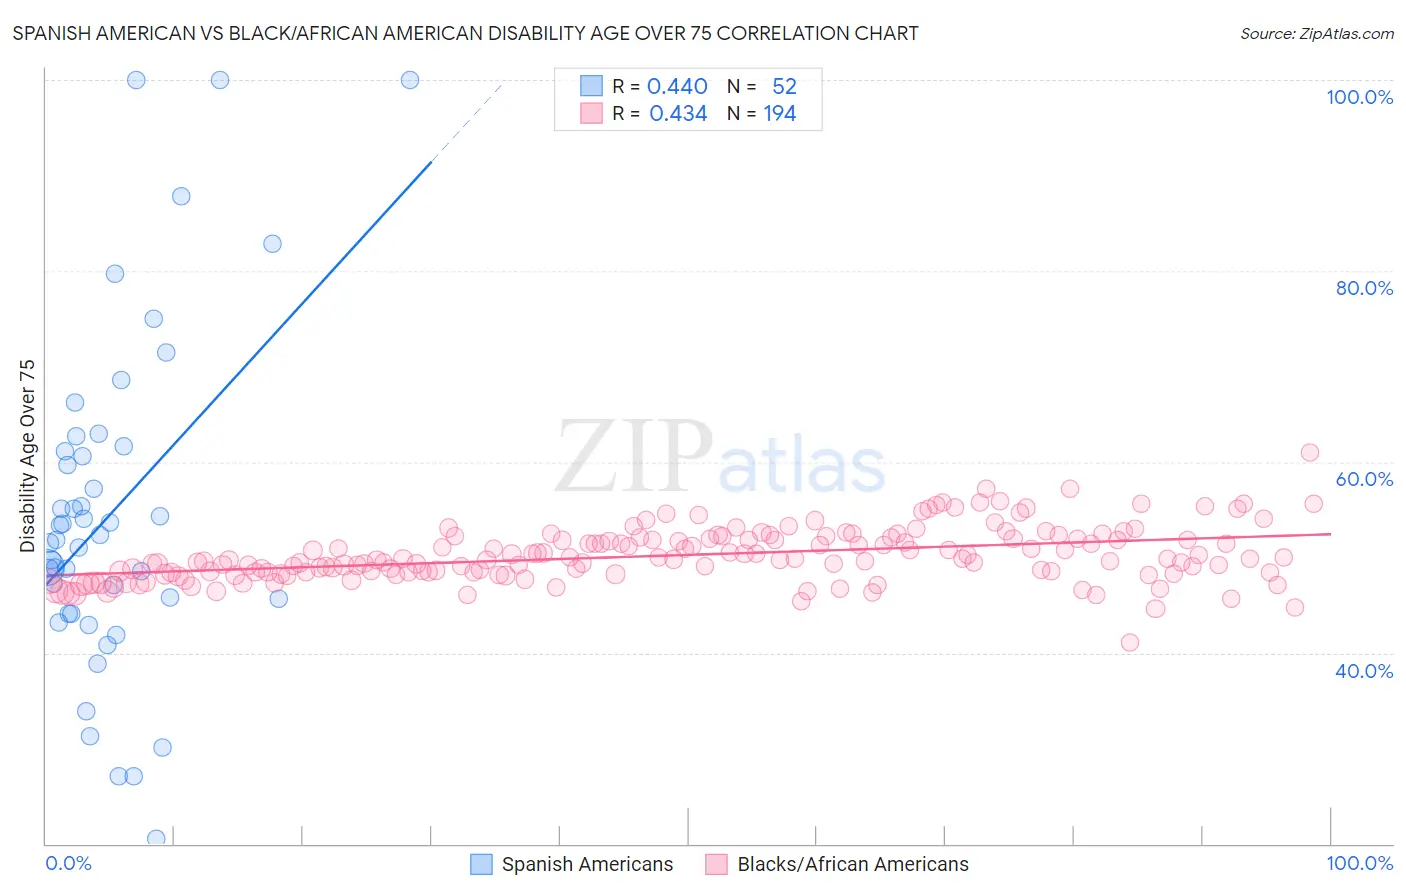
Spanish American vs Black/African American Disability Age Over 75 Correlation Chart
The statistical analysis conducted on geographies consisting of 103,158,462 people shows a moderate positive correlation between the proportion of Spanish Americans and percentage of population with a disability over the age of 75 in the United States with a correlation coefficient (R) of 0.440 and weighted average of 50.0%. Similarly, the statistical analysis conducted on geographies consisting of 563,629,175 people shows a moderate positive correlation between the proportion of Blacks/African Americans and percentage of population with a disability over the age of 75 in the United States with a correlation coefficient (R) of 0.434 and weighted average of 49.5%, a difference of 1.0%.
Disability Age Over 75 Correlation Summary
| Measurement | Spanish American | Black/African American |
| Minimum | 20.5% | 41.1% |
| Maximum | 100.0% | 61.0% |
| Range | 79.5% | 19.9% |
| Mean | 54.7% | 50.2% |
| Median | 52.1% | 49.8% |
| Interquartile 25% (IQ1) | 44.9% | 48.4% |
| Interquartile 75% (IQ3) | 61.4% | 52.0% |
| Interquartile Range (IQR) | 16.4% | 3.6% |
| Standard Deviation (Sample) | 17.6% | 2.8% |
| Standard Deviation (Population) | 17.5% | 2.8% |
Demographics Similar to Spanish Americans and Blacks/African Americans by Disability Age Over 75
In terms of disability age over 75, the demographic groups most similar to Spanish Americans are Immigrants from Cambodia (50.0%, a difference of 0.040%), Mexican American Indian (50.0%, a difference of 0.040%), Armenian (50.0%, a difference of 0.060%), Marshallese (50.1%, a difference of 0.12%), and Spanish American Indian (49.9%, a difference of 0.16%). Similarly, the demographic groups most similar to Blacks/African Americans are Samoan (49.5%, a difference of 0.030%), Immigrants from Latin America (49.5%, a difference of 0.080%), Belizean (49.4%, a difference of 0.14%), Bangladeshi (49.4%, a difference of 0.15%), and Guamanian/Chamorro (49.4%, a difference of 0.21%).
| Demographics | Rating | Rank | Disability Age Over 75 |
| Immigrants | Laos | 0.1 /100 | #278 | Tragic 49.2% |
| Guamanians/Chamorros | 0.0 /100 | #279 | Tragic 49.4% |
| Bangladeshis | 0.0 /100 | #280 | Tragic 49.4% |
| Belizeans | 0.0 /100 | #281 | Tragic 49.4% |
| Blacks/African Americans | 0.0 /100 | #282 | Tragic 49.5% |
| Samoans | 0.0 /100 | #283 | Tragic 49.5% |
| Immigrants | Latin America | 0.0 /100 | #284 | Tragic 49.5% |
| Crow | 0.0 /100 | #285 | Tragic 49.6% |
| Immigrants | Belize | 0.0 /100 | #286 | Tragic 49.6% |
| Sioux | 0.0 /100 | #287 | Tragic 49.7% |
| Yaqui | 0.0 /100 | #288 | Tragic 49.8% |
| Osage | 0.0 /100 | #289 | Tragic 49.8% |
| Puget Sound Salish | 0.0 /100 | #290 | Tragic 49.8% |
| Arapaho | 0.0 /100 | #291 | Tragic 49.8% |
| Shoshone | 0.0 /100 | #292 | Tragic 49.9% |
| Spanish American Indians | 0.0 /100 | #293 | Tragic 49.9% |
| Immigrants | Cambodia | 0.0 /100 | #294 | Tragic 50.0% |
| Spanish Americans | 0.0 /100 | #295 | Tragic 50.0% |
| Mexican American Indians | 0.0 /100 | #296 | Tragic 50.0% |
| Armenians | 0.0 /100 | #297 | Tragic 50.0% |
| Marshallese | 0.0 /100 | #298 | Tragic 50.1% |