Czechoslovakian vs Black/African American Householder Income Ages 45 - 64 years
COMPARE
Czechoslovakian
Black/African American
Householder Income Ages 45 - 64 years
Householder Income Ages 45 - 64 years Comparison
Czechoslovakians
Blacks/African Americans
$101,387
HOUSEHOLDER INCOME AGES 45 - 64 YEARS
63.0/ 100
METRIC RATING
167th/ 347
METRIC RANK
$78,556
HOUSEHOLDER INCOME AGES 45 - 64 YEARS
0.0/ 100
METRIC RATING
332nd/ 347
METRIC RANK
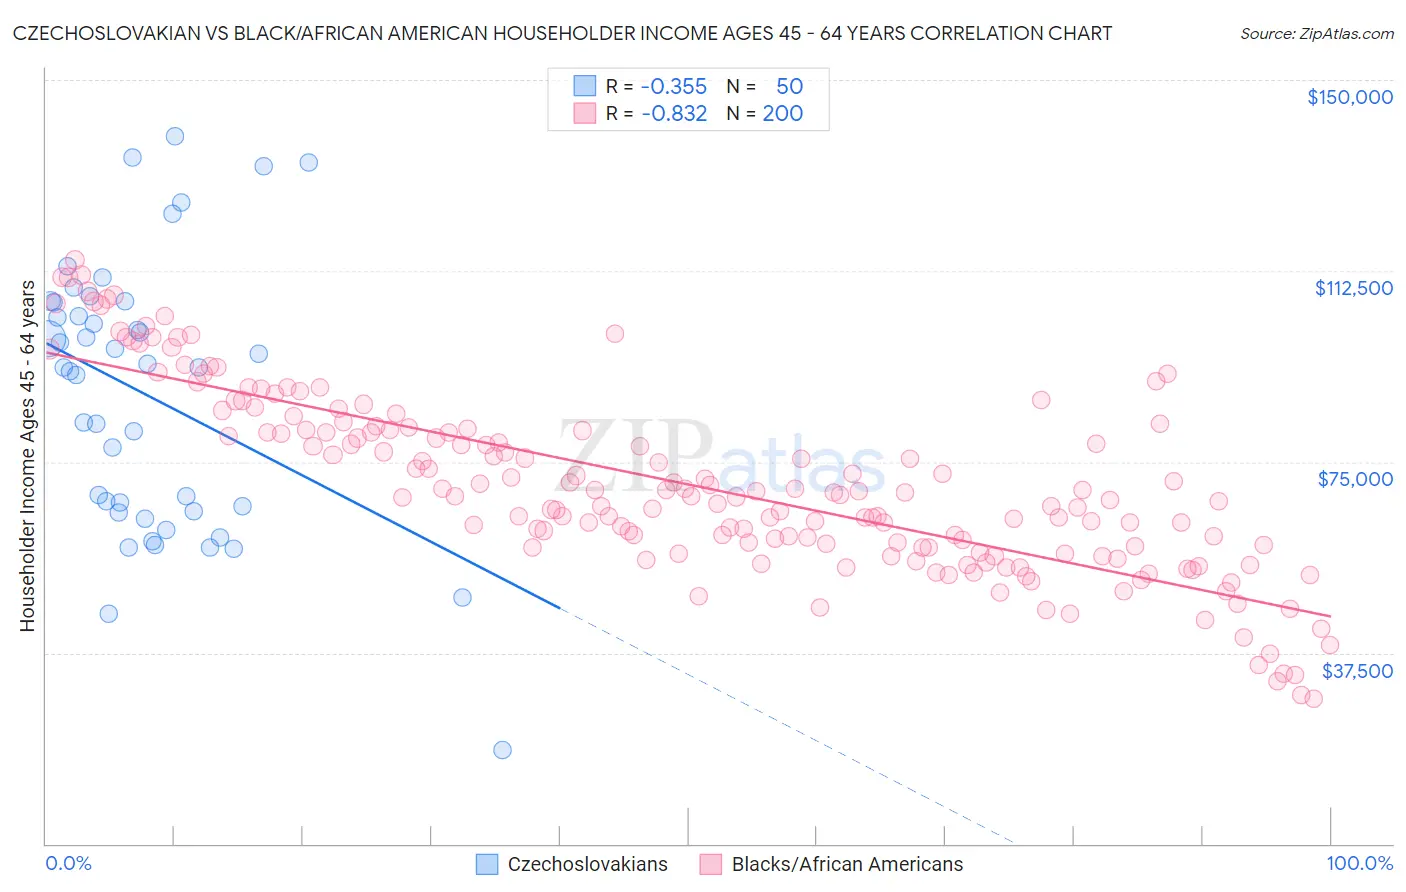
Czechoslovakian vs Black/African American Householder Income Ages 45 - 64 years Correlation Chart
The statistical analysis conducted on geographies consisting of 368,168,264 people shows a mild negative correlation between the proportion of Czechoslovakians and household income with householder between the ages 45 and 64 in the United States with a correlation coefficient (R) of -0.355 and weighted average of $101,387. Similarly, the statistical analysis conducted on geographies consisting of 562,323,408 people shows a very strong negative correlation between the proportion of Blacks/African Americans and household income with householder between the ages 45 and 64 in the United States with a correlation coefficient (R) of -0.832 and weighted average of $78,556, a difference of 29.1%.
Householder Income Ages 45 - 64 years Correlation Summary
| Measurement | Czechoslovakian | Black/African American |
| Minimum | $18,333 | $28,578 |
| Maximum | $138,929 | $114,640 |
| Range | $120,596 | $86,063 |
| Mean | $87,984 | $70,559 |
| Median | $93,579 | $68,403 |
| Interquartile 25% (IQ1) | $65,365 | $58,195 |
| Interquartile 75% (IQ3) | $106,355 | $81,447 |
| Interquartile Range (IQR) | $40,989 | $23,253 |
| Standard Deviation (Sample) | $26,471 | $18,044 |
| Standard Deviation (Population) | $26,205 | $17,998 |
Similar Demographics by Householder Income Ages 45 - 64 years
Demographics Similar to Czechoslovakians by Householder Income Ages 45 - 64 years
In terms of householder income ages 45 - 64 years, the demographic groups most similar to Czechoslovakians are Samoan ($101,580, a difference of 0.19%), South American Indian ($101,171, a difference of 0.21%), Guamanian/Chamorro ($101,170, a difference of 0.21%), Slovak ($101,029, a difference of 0.35%), and South American ($100,837, a difference of 0.54%).
| Demographics | Rating | Rank | Householder Income Ages 45 - 64 years |
| Icelanders | 72.5 /100 | #160 | Good $102,261 |
| Immigrants | Nepal | 71.8 /100 | #161 | Good $102,190 |
| Scottish | 71.1 /100 | #162 | Good $102,123 |
| English | 70.1 /100 | #163 | Good $102,021 |
| Immigrants | Morocco | 70.0 /100 | #164 | Good $102,015 |
| Immigrants | Albania | 69.4 /100 | #165 | Good $101,957 |
| Samoans | 65.3 /100 | #166 | Good $101,580 |
| Czechoslovakians | 63.0 /100 | #167 | Good $101,387 |
| South American Indians | 60.5 /100 | #168 | Good $101,171 |
| Guamanians/Chamorros | 60.5 /100 | #169 | Good $101,170 |
| Slovaks | 58.8 /100 | #170 | Average $101,029 |
| South Americans | 56.4 /100 | #171 | Average $100,837 |
| Immigrants | Uzbekistan | 52.5 /100 | #172 | Average $100,523 |
| Alsatians | 51.4 /100 | #173 | Average $100,435 |
| Welsh | 50.0 /100 | #174 | Average $100,322 |
Demographics Similar to Blacks/African Americans by Householder Income Ages 45 - 64 years
In terms of householder income ages 45 - 64 years, the demographic groups most similar to Blacks/African Americans are Immigrants from Dominican Republic ($78,836, a difference of 0.36%), Creek ($78,960, a difference of 0.51%), Dutch West Indian ($79,171, a difference of 0.78%), Immigrants from Congo ($77,850, a difference of 0.91%), and Native/Alaskan ($79,816, a difference of 1.6%).
| Demographics | Rating | Rank | Householder Income Ages 45 - 64 years |
| Immigrants | Cuba | 0.0 /100 | #325 | Tragic $80,662 |
| Dominicans | 0.0 /100 | #326 | Tragic $80,623 |
| Seminole | 0.0 /100 | #327 | Tragic $80,077 |
| Natives/Alaskans | 0.0 /100 | #328 | Tragic $79,816 |
| Dutch West Indians | 0.0 /100 | #329 | Tragic $79,171 |
| Creek | 0.0 /100 | #330 | Tragic $78,960 |
| Immigrants | Dominican Republic | 0.0 /100 | #331 | Tragic $78,836 |
| Blacks/African Americans | 0.0 /100 | #332 | Tragic $78,556 |
| Immigrants | Congo | 0.0 /100 | #333 | Tragic $77,850 |
| Menominee | 0.0 /100 | #334 | Tragic $76,903 |
| Cheyenne | 0.0 /100 | #335 | Tragic $76,362 |
| Arapaho | 0.0 /100 | #336 | Tragic $75,945 |
| Pueblo | 0.0 /100 | #337 | Tragic $75,601 |
| Hopi | 0.0 /100 | #338 | Tragic $75,562 |
| Kiowa | 0.0 /100 | #339 | Tragic $74,815 |