Spanish American vs Sri Lankan Householder Income Ages 45 - 64 years
COMPARE
Spanish American
Sri Lankan
Householder Income Ages 45 - 64 years
Householder Income Ages 45 - 64 years Comparison
Spanish Americans
Sri Lankans
$87,836
HOUSEHOLDER INCOME AGES 45 - 64 YEARS
0.2/ 100
METRIC RATING
269th/ 347
METRIC RANK
$108,270
HOUSEHOLDER INCOME AGES 45 - 64 YEARS
98.2/ 100
METRIC RATING
94th/ 347
METRIC RANK
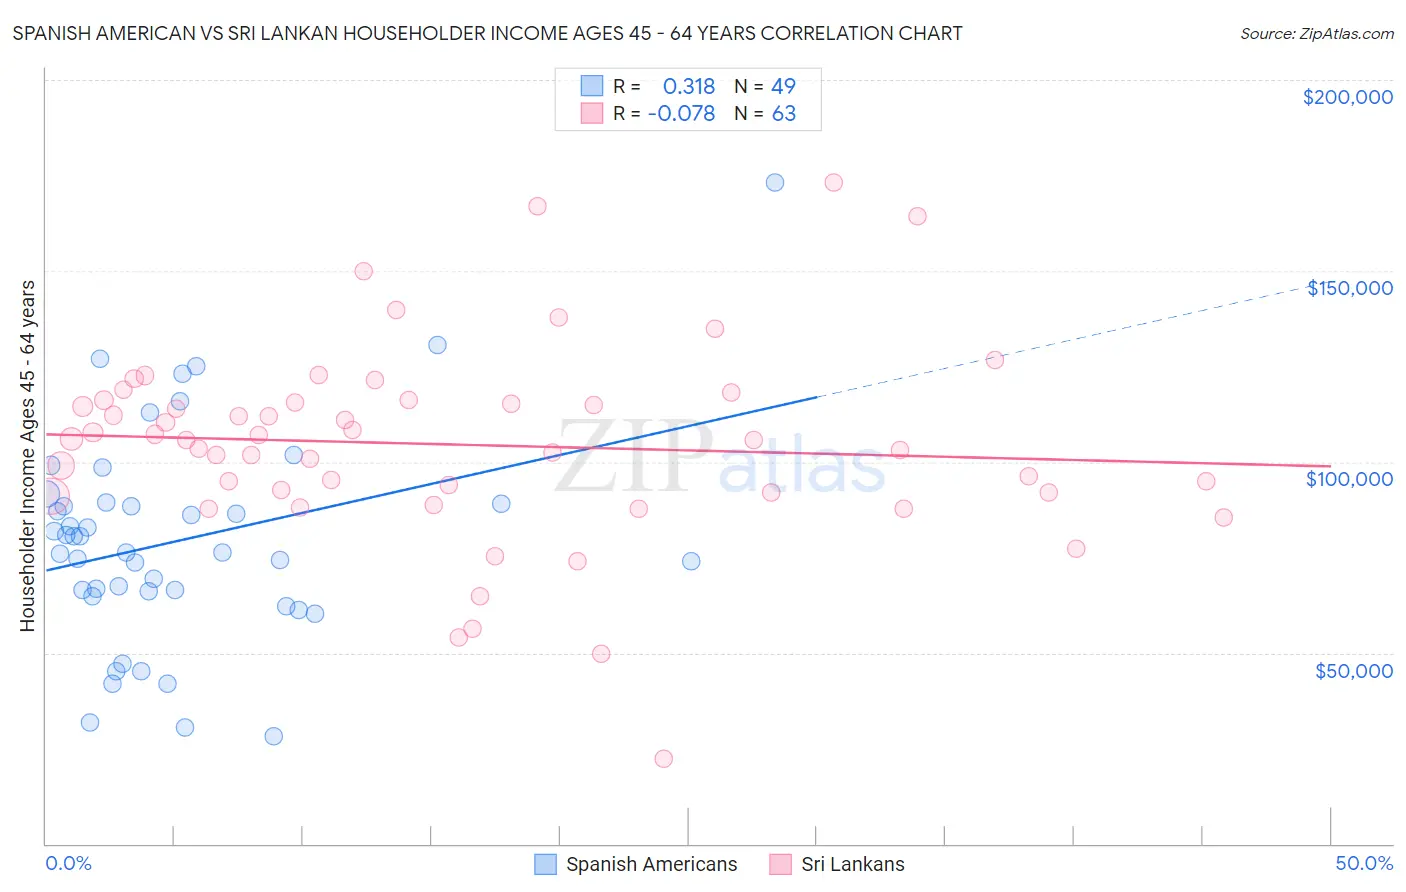
Spanish American vs Sri Lankan Householder Income Ages 45 - 64 years Correlation Chart
The statistical analysis conducted on geographies consisting of 103,142,376 people shows a mild positive correlation between the proportion of Spanish Americans and household income with householder between the ages 45 and 64 in the United States with a correlation coefficient (R) of 0.318 and weighted average of $87,836. Similarly, the statistical analysis conducted on geographies consisting of 439,428,647 people shows a slight negative correlation between the proportion of Sri Lankans and household income with householder between the ages 45 and 64 in the United States with a correlation coefficient (R) of -0.078 and weighted average of $108,270, a difference of 23.3%.
Householder Income Ages 45 - 64 years Correlation Summary
| Measurement | Spanish American | Sri Lankan |
| Minimum | $28,021 | $22,321 |
| Maximum | $173,295 | $173,169 |
| Range | $145,274 | $150,848 |
| Mean | $79,401 | $104,535 |
| Median | $76,250 | $105,686 |
| Interquartile 25% (IQ1) | $65,439 | $91,849 |
| Interquartile 75% (IQ3) | $89,172 | $116,139 |
| Interquartile Range (IQR) | $23,734 | $24,290 |
| Standard Deviation (Sample) | $28,080 | $26,133 |
| Standard Deviation (Population) | $27,792 | $25,925 |
Similar Demographics by Householder Income Ages 45 - 64 years
Demographics Similar to Spanish Americans by Householder Income Ages 45 - 64 years
In terms of householder income ages 45 - 64 years, the demographic groups most similar to Spanish Americans are Immigrants from Micronesia ($87,864, a difference of 0.030%), Immigrants from Liberia ($87,739, a difference of 0.11%), Guatemalan ($87,705, a difference of 0.15%), Cape Verdean ($87,580, a difference of 0.29%), and Spanish American Indian ($87,561, a difference of 0.31%).
| Demographics | Rating | Rank | Householder Income Ages 45 - 64 years |
| Somalis | 0.3 /100 | #262 | Tragic $88,600 |
| Immigrants | Senegal | 0.3 /100 | #263 | Tragic $88,421 |
| Osage | 0.3 /100 | #264 | Tragic $88,390 |
| Jamaicans | 0.2 /100 | #265 | Tragic $88,327 |
| Immigrants | West Indies | 0.2 /100 | #266 | Tragic $88,164 |
| Hmong | 0.2 /100 | #267 | Tragic $88,115 |
| Immigrants | Micronesia | 0.2 /100 | #268 | Tragic $87,864 |
| Spanish Americans | 0.2 /100 | #269 | Tragic $87,836 |
| Immigrants | Liberia | 0.2 /100 | #270 | Tragic $87,739 |
| Guatemalans | 0.2 /100 | #271 | Tragic $87,705 |
| Cape Verdeans | 0.2 /100 | #272 | Tragic $87,580 |
| Spanish American Indians | 0.2 /100 | #273 | Tragic $87,561 |
| Iroquois | 0.1 /100 | #274 | Tragic $87,255 |
| Immigrants | Belize | 0.1 /100 | #275 | Tragic $87,229 |
| Immigrants | Latin America | 0.1 /100 | #276 | Tragic $87,219 |
Demographics Similar to Sri Lankans by Householder Income Ages 45 - 64 years
In terms of householder income ages 45 - 64 years, the demographic groups most similar to Sri Lankans are Immigrants from Hungary ($108,267, a difference of 0.0%), Immigrants from Argentina ($108,264, a difference of 0.010%), Immigrants from Croatia ($108,304, a difference of 0.030%), Croatian ($108,383, a difference of 0.10%), and Ukrainian ($108,475, a difference of 0.19%).
| Demographics | Rating | Rank | Householder Income Ages 45 - 64 years |
| Tongans | 98.5 /100 | #87 | Exceptional $108,643 |
| Romanians | 98.5 /100 | #88 | Exceptional $108,609 |
| Ukrainians | 98.3 /100 | #89 | Exceptional $108,475 |
| Immigrants | Philippines | 98.3 /100 | #90 | Exceptional $108,471 |
| Immigrants | Lebanon | 98.3 /100 | #91 | Exceptional $108,471 |
| Croatians | 98.3 /100 | #92 | Exceptional $108,383 |
| Immigrants | Croatia | 98.2 /100 | #93 | Exceptional $108,304 |
| Sri Lankans | 98.2 /100 | #94 | Exceptional $108,270 |
| Immigrants | Hungary | 98.2 /100 | #95 | Exceptional $108,267 |
| Immigrants | Argentina | 98.2 /100 | #96 | Exceptional $108,264 |
| Northern Europeans | 97.8 /100 | #97 | Exceptional $107,870 |
| Immigrants | Southern Europe | 97.7 /100 | #98 | Exceptional $107,775 |
| Palestinians | 97.6 /100 | #99 | Exceptional $107,721 |
| Immigrants | Serbia | 97.4 /100 | #100 | Exceptional $107,569 |
| Immigrants | Kazakhstan | 97.2 /100 | #101 | Exceptional $107,378 |