Immigrants from the Azores vs Thai Wage/Income Gap
COMPARE
Immigrants from the Azores
Thai
Wage/Income Gap
Wage/Income Gap Comparison
Immigrants from the Azores
Thais
27.2%
WAGE/INCOME GAP
3.5/ 100
METRIC RATING
245th/ 347
METRIC RANK
30.5%
WAGE/INCOME GAP
0.0/ 100
METRIC RATING
341st/ 347
METRIC RANK
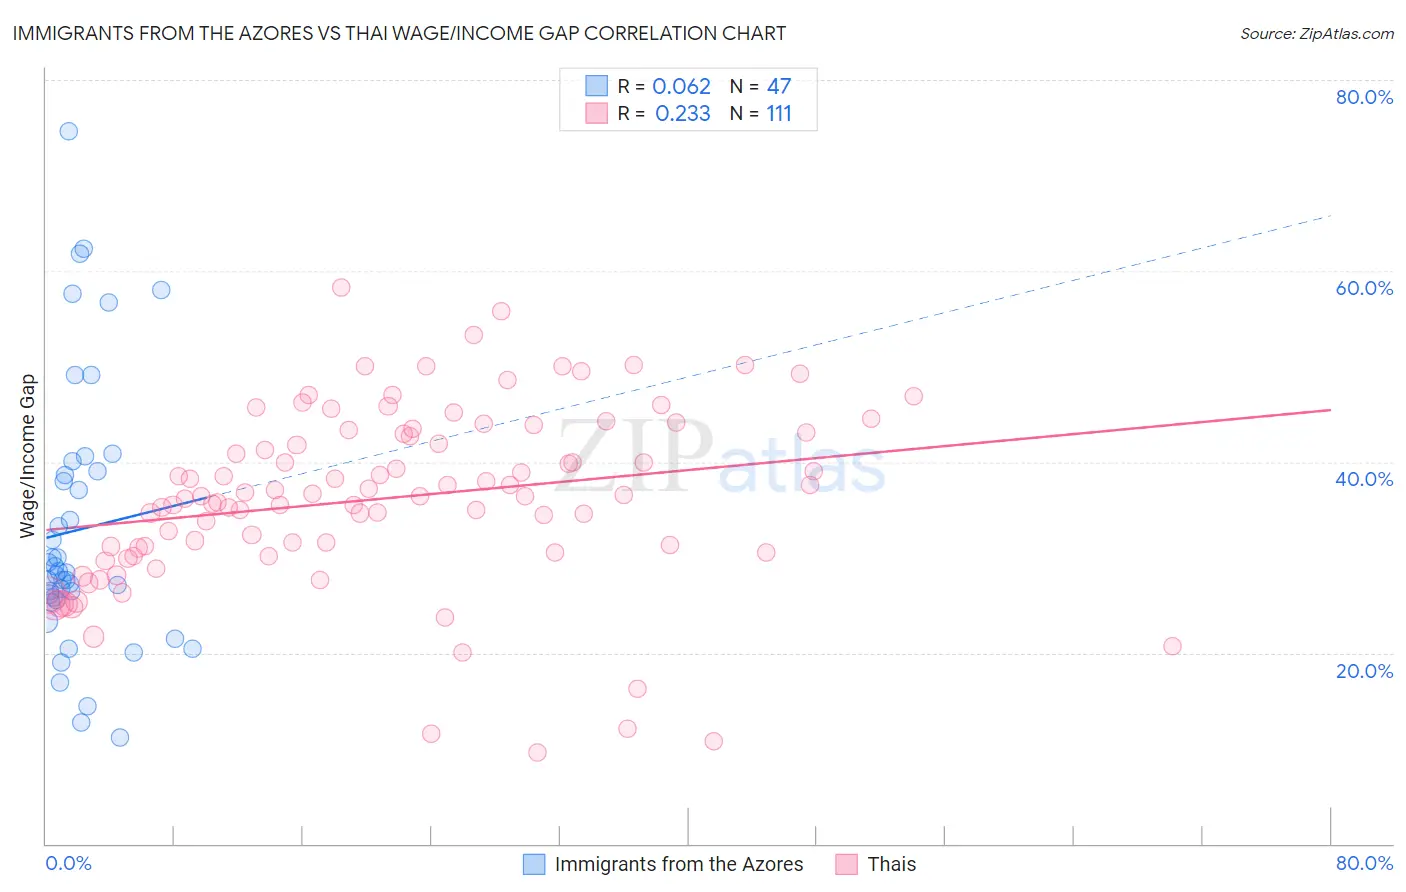
Immigrants from the Azores vs Thai Wage/Income Gap Correlation Chart
The statistical analysis conducted on geographies consisting of 46,247,590 people shows a slight positive correlation between the proportion of Immigrants from the Azores and wage/income gap percentage in the United States with a correlation coefficient (R) of 0.062 and weighted average of 27.2%. Similarly, the statistical analysis conducted on geographies consisting of 475,429,891 people shows a weak positive correlation between the proportion of Thais and wage/income gap percentage in the United States with a correlation coefficient (R) of 0.233 and weighted average of 30.5%, a difference of 12.1%.
Wage/Income Gap Correlation Summary
| Measurement | Immigrants from the Azores | Thai |
| Minimum | 11.1% | 9.5% |
| Maximum | 74.6% | 58.3% |
| Range | 63.5% | 48.7% |
| Mean | 32.9% | 36.2% |
| Median | 28.4% | 36.4% |
| Interquartile 25% (IQ1) | 25.6% | 30.5% |
| Interquartile 75% (IQ3) | 39.0% | 43.1% |
| Interquartile Range (IQR) | 13.4% | 12.6% |
| Standard Deviation (Sample) | 14.0% | 9.4% |
| Standard Deviation (Population) | 13.8% | 9.4% |
Similar Demographics by Wage/Income Gap
Demographics Similar to Immigrants from the Azores by Wage/Income Gap
In terms of wage/income gap, the demographic groups most similar to Immigrants from the Azores are Chickasaw (27.2%, a difference of 0.020%), Nonimmigrants (27.2%, a difference of 0.080%), Immigrants from Sri Lanka (27.1%, a difference of 0.090%), Spanish (27.1%, a difference of 0.090%), and Creek (27.1%, a difference of 0.14%).
| Demographics | Rating | Rank | Wage/Income Gap |
| Osage | 4.4 /100 | #238 | Tragic 27.1% |
| Estonians | 4.3 /100 | #239 | Tragic 27.1% |
| Immigrants | Europe | 3.8 /100 | #240 | Tragic 27.1% |
| Creek | 3.8 /100 | #241 | Tragic 27.1% |
| Immigrants | Sri Lanka | 3.7 /100 | #242 | Tragic 27.1% |
| Spanish | 3.6 /100 | #243 | Tragic 27.1% |
| Chickasaw | 3.5 /100 | #244 | Tragic 27.2% |
| Immigrants | Azores | 3.5 /100 | #245 | Tragic 27.2% |
| Immigrants | Nonimmigrants | 3.3 /100 | #246 | Tragic 27.2% |
| Celtics | 2.8 /100 | #247 | Tragic 27.3% |
| Cypriots | 2.8 /100 | #248 | Tragic 27.3% |
| Carpatho Rusyns | 2.7 /100 | #249 | Tragic 27.3% |
| Immigrants | Czechoslovakia | 2.7 /100 | #250 | Tragic 27.3% |
| Immigrants | Norway | 2.5 /100 | #251 | Tragic 27.3% |
| Ukrainians | 2.4 /100 | #252 | Tragic 27.3% |
Demographics Similar to Thais by Wage/Income Gap
In terms of wage/income gap, the demographic groups most similar to Thais are Pennsylvania German (30.7%, a difference of 0.77%), Danish (31.0%, a difference of 1.6%), Swiss (30.0%, a difference of 1.7%), Assyrian/Chaldean/Syriac (31.0%, a difference of 1.8%), and Iranian (29.7%, a difference of 2.5%).
| Demographics | Rating | Rank | Wage/Income Gap |
| Europeans | 0.0 /100 | #333 | Tragic 29.4% |
| Swedes | 0.0 /100 | #334 | Tragic 29.4% |
| Immigrants | Taiwan | 0.0 /100 | #335 | Tragic 29.5% |
| English | 0.0 /100 | #336 | Tragic 29.5% |
| Dutch | 0.0 /100 | #337 | Tragic 29.6% |
| Filipinos | 0.0 /100 | #338 | Tragic 29.7% |
| Iranians | 0.0 /100 | #339 | Tragic 29.7% |
| Swiss | 0.0 /100 | #340 | Tragic 30.0% |
| Thais | 0.0 /100 | #341 | Tragic 30.5% |
| Pennsylvania Germans | 0.0 /100 | #342 | Tragic 30.7% |
| Danes | 0.0 /100 | #343 | Tragic 31.0% |
| Assyrians/Chaldeans/Syriacs | 0.0 /100 | #344 | Tragic 31.0% |
| Immigrants | India | 0.0 /100 | #345 | Tragic 31.5% |
| Cajuns | 0.0 /100 | #346 | Tragic 33.9% |
| Houma | 0.0 /100 | #347 | Tragic 38.7% |