Basque vs Trinidadian and Tobagonian Wage/Income Gap
COMPARE
Basque
Trinidadian and Tobagonian
Wage/Income Gap
Wage/Income Gap Comparison
Basques
Trinidadians and Tobagonians
28.8%
WAGE/INCOME GAP
0.1/ 100
METRIC RATING
318th/ 347
METRIC RANK
19.3%
WAGE/INCOME GAP
100.0/ 100
METRIC RATING
13th/ 347
METRIC RANK
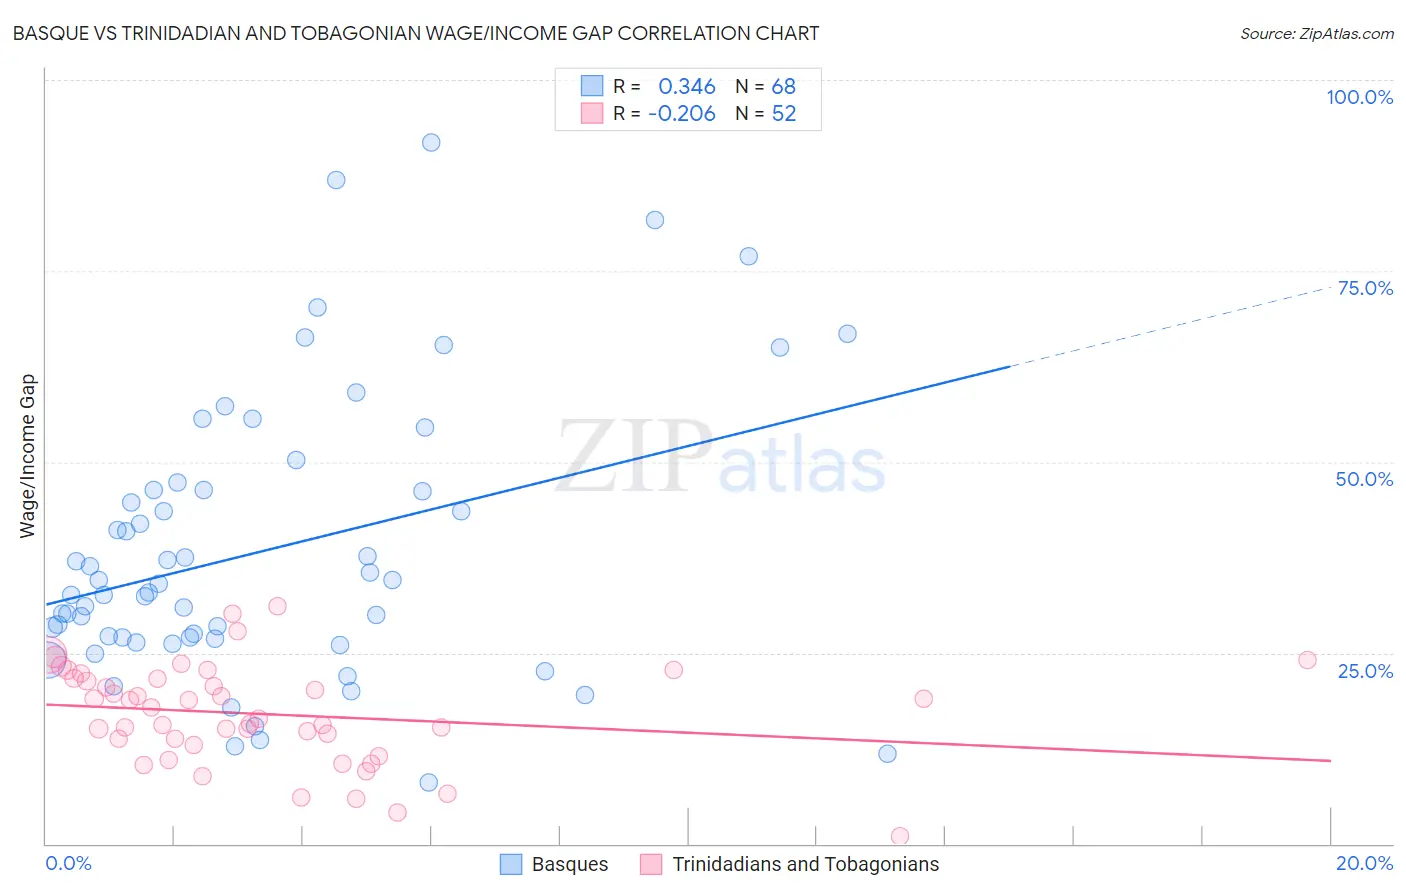
Basque vs Trinidadian and Tobagonian Wage/Income Gap Correlation Chart
The statistical analysis conducted on geographies consisting of 165,712,843 people shows a mild positive correlation between the proportion of Basques and wage/income gap percentage in the United States with a correlation coefficient (R) of 0.346 and weighted average of 28.8%. Similarly, the statistical analysis conducted on geographies consisting of 219,803,176 people shows a weak negative correlation between the proportion of Trinidadians and Tobagonians and wage/income gap percentage in the United States with a correlation coefficient (R) of -0.206 and weighted average of 19.3%, a difference of 49.0%.
Wage/Income Gap Correlation Summary
| Measurement | Basque | Trinidadian and Tobagonian |
| Minimum | 8.0% | 1.0% |
| Maximum | 91.8% | 31.1% |
| Range | 83.8% | 30.1% |
| Mean | 38.5% | 16.9% |
| Median | 33.4% | 17.1% |
| Interquartile 25% (IQ1) | 26.9% | 13.3% |
| Interquartile 75% (IQ3) | 46.3% | 21.6% |
| Interquartile Range (IQR) | 19.3% | 8.3% |
| Standard Deviation (Sample) | 18.3% | 6.5% |
| Standard Deviation (Population) | 18.2% | 6.4% |
Similar Demographics by Wage/Income Gap
Demographics Similar to Basques by Wage/Income Gap
In terms of wage/income gap, the demographic groups most similar to Basques are Belgian (28.8%, a difference of 0.050%), Lithuanian (28.7%, a difference of 0.16%), Maltese (28.7%, a difference of 0.17%), Immigrants from Scotland (28.7%, a difference of 0.22%), and Slovak (28.9%, a difference of 0.31%).
| Demographics | Rating | Rank | Wage/Income Gap |
| Immigrants | Lithuania | 0.1 /100 | #311 | Tragic 28.6% |
| Eastern Europeans | 0.1 /100 | #312 | Tragic 28.6% |
| French | 0.1 /100 | #313 | Tragic 28.7% |
| Immigrants | Scotland | 0.1 /100 | #314 | Tragic 28.7% |
| Maltese | 0.1 /100 | #315 | Tragic 28.7% |
| Lithuanians | 0.1 /100 | #316 | Tragic 28.7% |
| Belgians | 0.1 /100 | #317 | Tragic 28.8% |
| Basques | 0.1 /100 | #318 | Tragic 28.8% |
| Slovaks | 0.1 /100 | #319 | Tragic 28.9% |
| British | 0.1 /100 | #320 | Tragic 28.9% |
| Welsh | 0.1 /100 | #321 | Tragic 28.9% |
| Immigrants | Singapore | 0.1 /100 | #322 | Tragic 28.9% |
| Norwegians | 0.1 /100 | #323 | Tragic 29.0% |
| Croatians | 0.0 /100 | #324 | Tragic 29.0% |
| Hungarians | 0.0 /100 | #325 | Tragic 29.0% |
Demographics Similar to Trinidadians and Tobagonians by Wage/Income Gap
In terms of wage/income gap, the demographic groups most similar to Trinidadians and Tobagonians are Immigrants from Trinidad and Tobago (19.3%, a difference of 0.050%), Immigrants from West Indies (19.2%, a difference of 0.48%), Immigrants from Haiti (19.2%, a difference of 0.59%), West Indian (19.6%, a difference of 1.2%), and Jamaican (19.6%, a difference of 1.4%).
| Demographics | Rating | Rank | Wage/Income Gap |
| Immigrants | Guyana | 100.0 /100 | #6 | Exceptional 18.4% |
| Puerto Ricans | 100.0 /100 | #7 | Exceptional 18.7% |
| Immigrants | Jamaica | 100.0 /100 | #8 | Exceptional 18.8% |
| Barbadians | 100.0 /100 | #9 | Exceptional 19.0% |
| Crow | 100.0 /100 | #10 | Exceptional 19.1% |
| Immigrants | Haiti | 100.0 /100 | #11 | Exceptional 19.2% |
| Immigrants | West Indies | 100.0 /100 | #12 | Exceptional 19.2% |
| Trinidadians and Tobagonians | 100.0 /100 | #13 | Exceptional 19.3% |
| Immigrants | Trinidad and Tobago | 100.0 /100 | #14 | Exceptional 19.3% |
| West Indians | 100.0 /100 | #15 | Exceptional 19.6% |
| Jamaicans | 100.0 /100 | #16 | Exceptional 19.6% |
| Haitians | 100.0 /100 | #17 | Exceptional 19.7% |
| Hopi | 100.0 /100 | #18 | Exceptional 20.0% |
| Immigrants | Dominica | 100.0 /100 | #19 | Exceptional 20.0% |
| Bahamians | 100.0 /100 | #20 | Exceptional 20.2% |