Spaniard vs Iraqi Hearing Disability
COMPARE
Spaniard
Iraqi
Hearing Disability
Hearing Disability Comparison
Spaniards
Iraqis
3.5%
HEARING DISABILITY
0.1/ 100
METRIC RATING
268th/ 347
METRIC RANK
3.1%
HEARING DISABILITY
19.0/ 100
METRIC RATING
201st/ 347
METRIC RANK
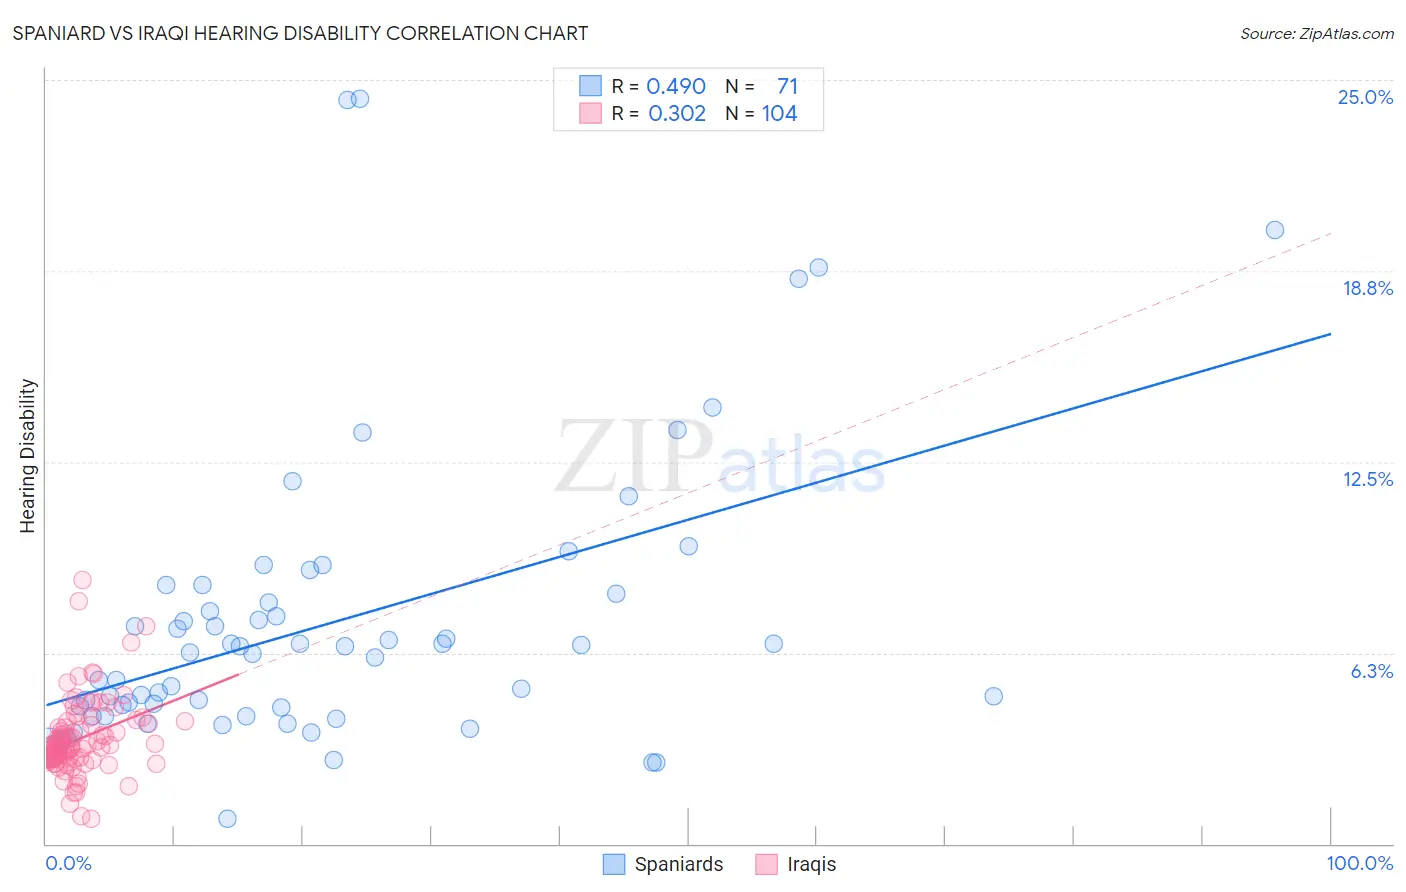
Spaniard vs Iraqi Hearing Disability Correlation Chart
The statistical analysis conducted on geographies consisting of 443,274,447 people shows a moderate positive correlation between the proportion of Spaniards and percentage of population with hearing disability in the United States with a correlation coefficient (R) of 0.490 and weighted average of 3.5%. Similarly, the statistical analysis conducted on geographies consisting of 170,639,688 people shows a mild positive correlation between the proportion of Iraqis and percentage of population with hearing disability in the United States with a correlation coefficient (R) of 0.302 and weighted average of 3.1%, a difference of 12.6%.
Hearing Disability Correlation Summary
| Measurement | Spaniard | Iraqi |
| Minimum | 0.81% | 0.83% |
| Maximum | 24.4% | 8.7% |
| Range | 23.6% | 7.8% |
| Mean | 7.2% | 3.4% |
| Median | 6.2% | 3.1% |
| Interquartile 25% (IQ1) | 4.2% | 2.8% |
| Interquartile 75% (IQ3) | 8.2% | 3.9% |
| Interquartile Range (IQR) | 4.0% | 1.1% |
| Standard Deviation (Sample) | 4.7% | 1.2% |
| Standard Deviation (Population) | 4.7% | 1.2% |
Similar Demographics by Hearing Disability
Demographics Similar to Spaniards by Hearing Disability
In terms of hearing disability, the demographic groups most similar to Spaniards are Canadian (3.5%, a difference of 0.020%), Belgian (3.5%, a difference of 0.24%), Ute (3.5%, a difference of 0.30%), British (3.5%, a difference of 0.42%), and Immigrants from Germany (3.5%, a difference of 0.44%).
| Demographics | Rating | Rank | Hearing Disability |
| Hawaiians | 0.1 /100 | #261 | Tragic 3.5% |
| Immigrants | North America | 0.1 /100 | #262 | Tragic 3.5% |
| Immigrants | Canada | 0.1 /100 | #263 | Tragic 3.5% |
| Immigrants | Germany | 0.1 /100 | #264 | Tragic 3.5% |
| British | 0.1 /100 | #265 | Tragic 3.5% |
| Belgians | 0.1 /100 | #266 | Tragic 3.5% |
| Canadians | 0.1 /100 | #267 | Tragic 3.5% |
| Spaniards | 0.1 /100 | #268 | Tragic 3.5% |
| Ute | 0.1 /100 | #269 | Tragic 3.5% |
| Europeans | 0.1 /100 | #270 | Tragic 3.5% |
| Czechs | 0.1 /100 | #271 | Tragic 3.5% |
| Fijians | 0.0 /100 | #272 | Tragic 3.5% |
| Puerto Ricans | 0.0 /100 | #273 | Tragic 3.5% |
| Swiss | 0.0 /100 | #274 | Tragic 3.5% |
| Czechoslovakians | 0.0 /100 | #275 | Tragic 3.6% |
Demographics Similar to Iraqis by Hearing Disability
In terms of hearing disability, the demographic groups most similar to Iraqis are Immigrants from North Macedonia (3.1%, a difference of 0.020%), Syrian (3.1%, a difference of 0.030%), Immigrants from Croatia (3.1%, a difference of 0.22%), Immigrants from Bosnia and Herzegovina (3.1%, a difference of 0.24%), and Immigrants from Thailand (3.1%, a difference of 0.40%).
| Demographics | Rating | Rank | Hearing Disability |
| South Africans | 24.5 /100 | #194 | Fair 3.1% |
| Spanish American Indians | 24.1 /100 | #195 | Fair 3.1% |
| Immigrants | Europe | 22.9 /100 | #196 | Fair 3.1% |
| Immigrants | Bosnia and Herzegovina | 20.6 /100 | #197 | Fair 3.1% |
| Immigrants | Croatia | 20.5 /100 | #198 | Fair 3.1% |
| Syrians | 19.2 /100 | #199 | Poor 3.1% |
| Immigrants | North Macedonia | 19.1 /100 | #200 | Poor 3.1% |
| Iraqis | 19.0 /100 | #201 | Poor 3.1% |
| Immigrants | Thailand | 16.4 /100 | #202 | Poor 3.1% |
| Immigrants | Denmark | 16.2 /100 | #203 | Poor 3.1% |
| Immigrants | Czechoslovakia | 15.9 /100 | #204 | Poor 3.1% |
| Alsatians | 15.9 /100 | #205 | Poor 3.1% |
| Eastern Europeans | 15.5 /100 | #206 | Poor 3.1% |
| Hispanics or Latinos | 15.1 /100 | #207 | Poor 3.1% |
| Immigrants | Latvia | 12.7 /100 | #208 | Poor 3.1% |