Creek vs Indonesian Median Female Earnings
COMPARE
Creek
Indonesian
Median Female Earnings
Median Female Earnings Comparison
Creek
Indonesians
$33,437
MEDIAN FEMALE EARNINGS
0.0/ 100
METRIC RATING
335th/ 347
METRIC RANK
$36,140
MEDIAN FEMALE EARNINGS
0.1/ 100
METRIC RATING
284th/ 347
METRIC RANK
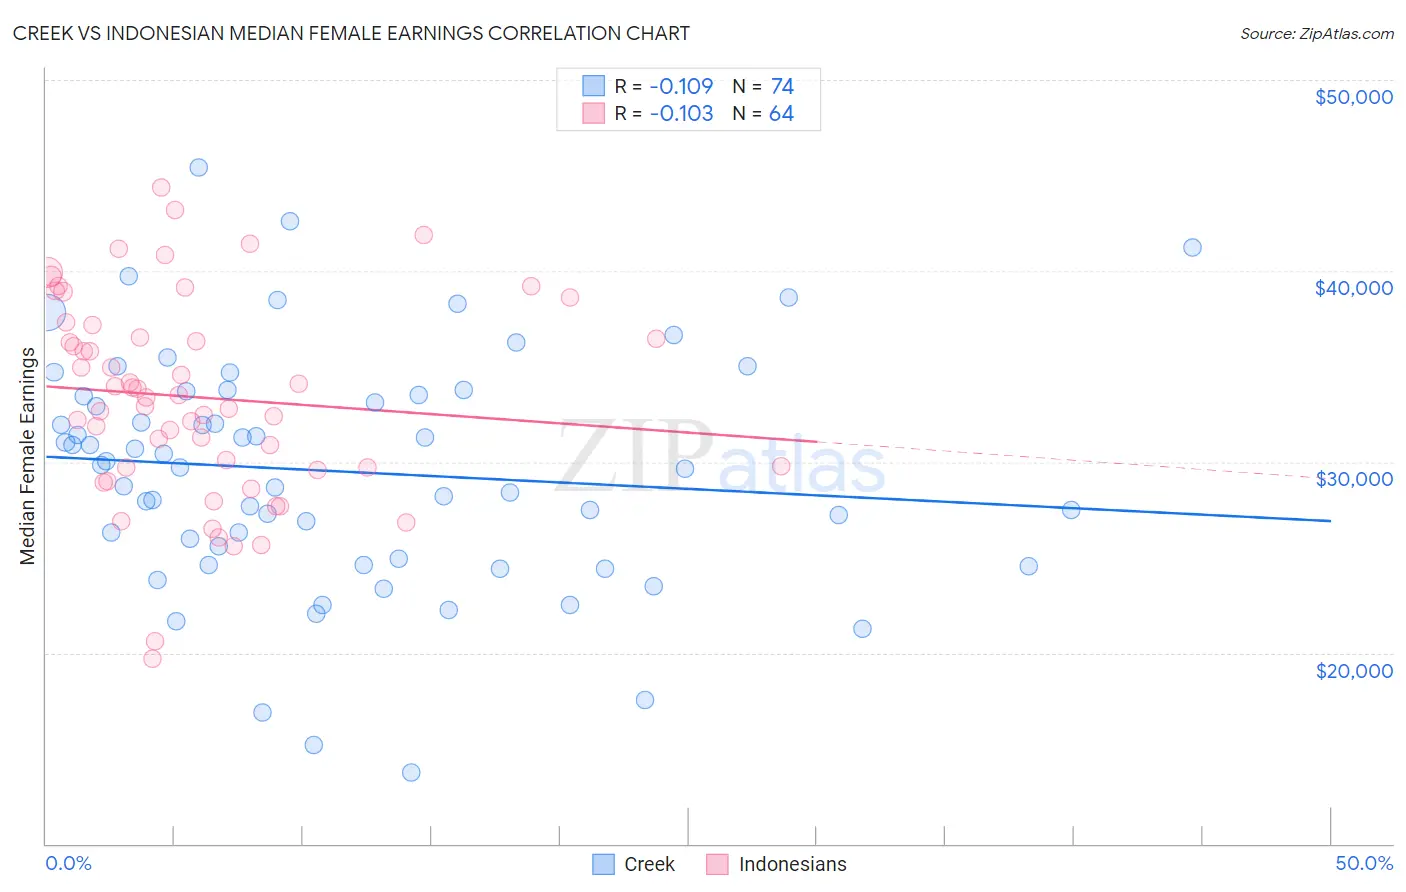
Creek vs Indonesian Median Female Earnings Correlation Chart
The statistical analysis conducted on geographies consisting of 178,409,483 people shows a poor negative correlation between the proportion of Creek and median female earnings in the United States with a correlation coefficient (R) of -0.109 and weighted average of $33,437. Similarly, the statistical analysis conducted on geographies consisting of 162,730,900 people shows a poor negative correlation between the proportion of Indonesians and median female earnings in the United States with a correlation coefficient (R) of -0.103 and weighted average of $36,140, a difference of 8.1%.
Median Female Earnings Correlation Summary
| Measurement | Creek | Indonesian |
| Minimum | $13,750 | $19,686 |
| Maximum | $45,402 | $44,373 |
| Range | $31,652 | $24,687 |
| Mean | $29,490 | $33,375 |
| Median | $29,783 | $33,447 |
| Interquartile 25% (IQ1) | $24,936 | $29,712 |
| Interquartile 75% (IQ3) | $33,500 | $36,850 |
| Interquartile Range (IQR) | $8,564 | $7,138 |
| Standard Deviation (Sample) | $6,205 | $5,258 |
| Standard Deviation (Population) | $6,162 | $5,217 |
Similar Demographics by Median Female Earnings
Demographics Similar to Creek by Median Female Earnings
In terms of median female earnings, the demographic groups most similar to Creek are Ottawa ($33,378, a difference of 0.18%), Yakama ($33,354, a difference of 0.25%), Immigrants from Cuba ($33,291, a difference of 0.44%), Spanish American Indian ($33,625, a difference of 0.56%), and Immigrants from Mexico ($33,236, a difference of 0.61%).
| Demographics | Rating | Rank | Median Female Earnings |
| Immigrants | Central America | 0.0 /100 | #328 | Tragic $33,953 |
| Hopi | 0.0 /100 | #329 | Tragic $33,932 |
| Menominee | 0.0 /100 | #330 | Tragic $33,894 |
| Natives/Alaskans | 0.0 /100 | #331 | Tragic $33,806 |
| Choctaw | 0.0 /100 | #332 | Tragic $33,775 |
| Mexicans | 0.0 /100 | #333 | Tragic $33,664 |
| Spanish American Indians | 0.0 /100 | #334 | Tragic $33,625 |
| Creek | 0.0 /100 | #335 | Tragic $33,437 |
| Ottawa | 0.0 /100 | #336 | Tragic $33,378 |
| Yakama | 0.0 /100 | #337 | Tragic $33,354 |
| Immigrants | Cuba | 0.0 /100 | #338 | Tragic $33,291 |
| Immigrants | Mexico | 0.0 /100 | #339 | Tragic $33,236 |
| Tohono O'odham | 0.0 /100 | #340 | Tragic $33,205 |
| Navajo | 0.0 /100 | #341 | Tragic $33,046 |
| Yup'ik | 0.0 /100 | #342 | Tragic $32,730 |
Demographics Similar to Indonesians by Median Female Earnings
In terms of median female earnings, the demographic groups most similar to Indonesians are Immigrants from Haiti ($36,203, a difference of 0.17%), Paiute ($36,056, a difference of 0.23%), Osage ($36,034, a difference of 0.29%), Immigrants from Nicaragua ($36,023, a difference of 0.33%), and Immigrants from Zaire ($36,017, a difference of 0.34%).
| Demographics | Rating | Rank | Median Female Earnings |
| Marshallese | 0.1 /100 | #277 | Tragic $36,459 |
| U.S. Virgin Islanders | 0.1 /100 | #278 | Tragic $36,424 |
| Immigrants | Caribbean | 0.1 /100 | #279 | Tragic $36,414 |
| Iroquois | 0.1 /100 | #280 | Tragic $36,408 |
| Spanish Americans | 0.1 /100 | #281 | Tragic $36,391 |
| Haitians | 0.1 /100 | #282 | Tragic $36,374 |
| Immigrants | Haiti | 0.1 /100 | #283 | Tragic $36,203 |
| Indonesians | 0.1 /100 | #284 | Tragic $36,140 |
| Paiute | 0.1 /100 | #285 | Tragic $36,056 |
| Osage | 0.0 /100 | #286 | Tragic $36,034 |
| Immigrants | Nicaragua | 0.0 /100 | #287 | Tragic $36,023 |
| Immigrants | Zaire | 0.0 /100 | #288 | Tragic $36,017 |
| Bangladeshis | 0.0 /100 | #289 | Tragic $35,960 |
| Central American Indians | 0.0 /100 | #290 | Tragic $35,930 |
| Blackfeet | 0.0 /100 | #291 | Tragic $35,864 |