Immigrants from Kuwait vs Indonesian Median Female Earnings
COMPARE
Immigrants from Kuwait
Indonesian
Median Female Earnings
Median Female Earnings Comparison
Immigrants from Kuwait
Indonesians
$41,055
MEDIAN FEMALE EARNINGS
94.4/ 100
METRIC RATING
120th/ 347
METRIC RANK
$36,140
MEDIAN FEMALE EARNINGS
0.1/ 100
METRIC RATING
284th/ 347
METRIC RANK
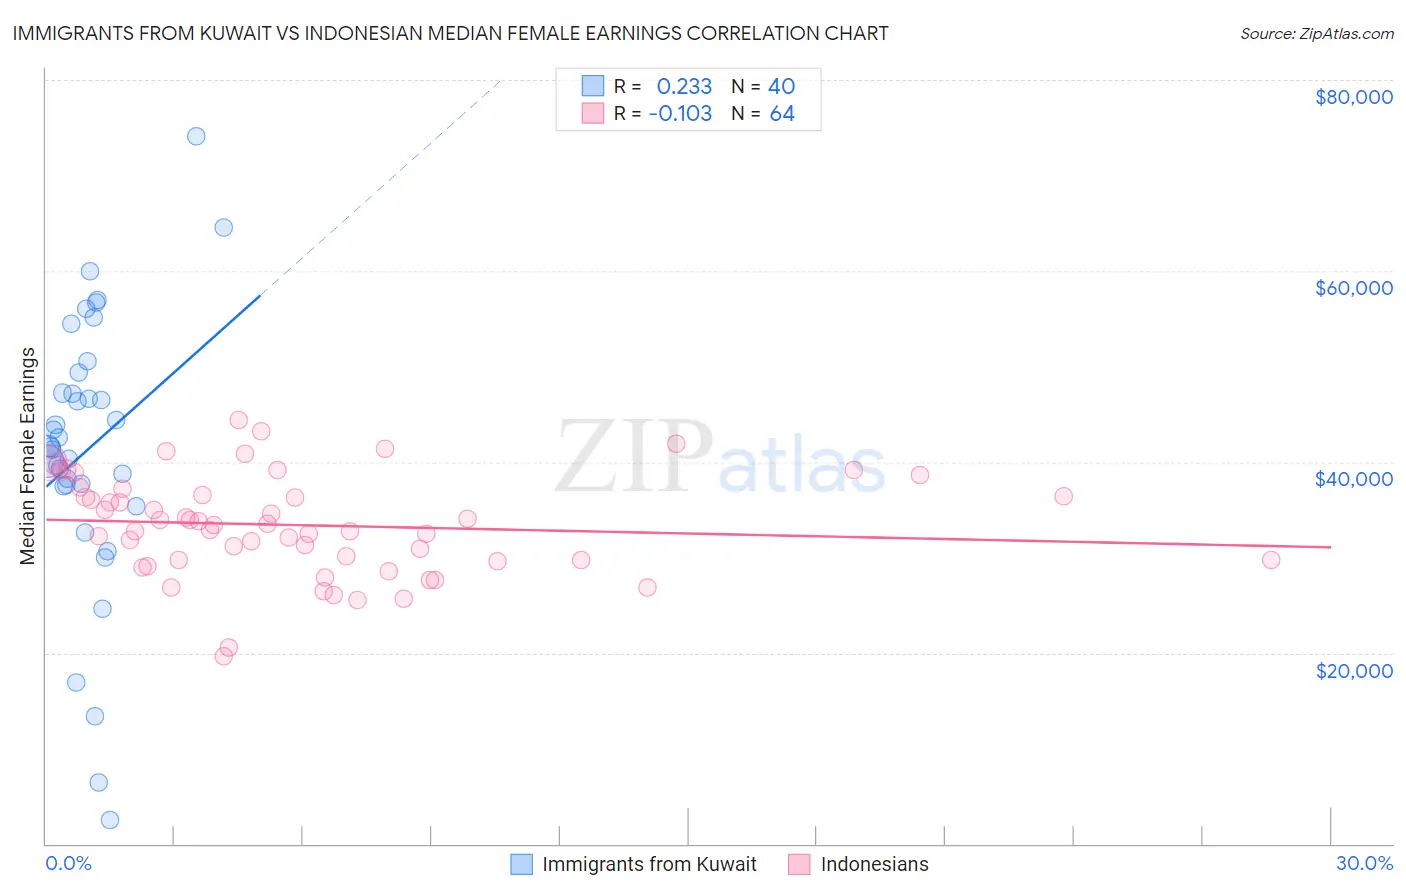
Immigrants from Kuwait vs Indonesian Median Female Earnings Correlation Chart
The statistical analysis conducted on geographies consisting of 136,915,503 people shows a weak positive correlation between the proportion of Immigrants from Kuwait and median female earnings in the United States with a correlation coefficient (R) of 0.233 and weighted average of $41,055. Similarly, the statistical analysis conducted on geographies consisting of 162,730,900 people shows a poor negative correlation between the proportion of Indonesians and median female earnings in the United States with a correlation coefficient (R) of -0.103 and weighted average of $36,140, a difference of 13.6%.
Median Female Earnings Correlation Summary
| Measurement | Immigrants from Kuwait | Indonesian |
| Minimum | $2,499 | $19,686 |
| Maximum | $74,079 | $44,373 |
| Range | $71,580 | $24,687 |
| Mean | $41,287 | $33,375 |
| Median | $41,597 | $33,447 |
| Interquartile 25% (IQ1) | $37,555 | $29,712 |
| Interquartile 75% (IQ3) | $48,255 | $36,850 |
| Interquartile Range (IQR) | $10,700 | $7,138 |
| Standard Deviation (Sample) | $14,451 | $5,258 |
| Standard Deviation (Population) | $14,269 | $5,217 |
Similar Demographics by Median Female Earnings
Demographics Similar to Immigrants from Kuwait by Median Female Earnings
In terms of median female earnings, the demographic groups most similar to Immigrants from Kuwait are Immigrants from Philippines ($41,114, a difference of 0.15%), Croatian ($40,993, a difference of 0.15%), Immigrants from Jordan ($40,977, a difference of 0.19%), Guyanese ($40,973, a difference of 0.20%), and Trinidadian and Tobagonian ($40,958, a difference of 0.24%).
| Demographics | Rating | Rank | Median Female Earnings |
| Macedonians | 96.4 /100 | #113 | Exceptional $41,286 |
| Immigrants | England | 96.4 /100 | #114 | Exceptional $41,277 |
| Koreans | 96.4 /100 | #115 | Exceptional $41,276 |
| Immigrants | Brazil | 96.4 /100 | #116 | Exceptional $41,273 |
| Barbadians | 96.3 /100 | #117 | Exceptional $41,261 |
| Immigrants | Lebanon | 95.6 /100 | #118 | Exceptional $41,183 |
| Immigrants | Philippines | 95.0 /100 | #119 | Exceptional $41,114 |
| Immigrants | Kuwait | 94.4 /100 | #120 | Exceptional $41,055 |
| Croatians | 93.7 /100 | #121 | Exceptional $40,993 |
| Immigrants | Jordan | 93.5 /100 | #122 | Exceptional $40,977 |
| Guyanese | 93.4 /100 | #123 | Exceptional $40,973 |
| Trinidadians and Tobagonians | 93.2 /100 | #124 | Exceptional $40,958 |
| Austrians | 92.7 /100 | #125 | Exceptional $40,923 |
| Immigrants | Trinidad and Tobago | 92.3 /100 | #126 | Exceptional $40,895 |
| Ugandans | 92.2 /100 | #127 | Exceptional $40,889 |
Demographics Similar to Indonesians by Median Female Earnings
In terms of median female earnings, the demographic groups most similar to Indonesians are Immigrants from Haiti ($36,203, a difference of 0.17%), Paiute ($36,056, a difference of 0.23%), Osage ($36,034, a difference of 0.29%), Immigrants from Nicaragua ($36,023, a difference of 0.33%), and Immigrants from Zaire ($36,017, a difference of 0.34%).
| Demographics | Rating | Rank | Median Female Earnings |
| Marshallese | 0.1 /100 | #277 | Tragic $36,459 |
| U.S. Virgin Islanders | 0.1 /100 | #278 | Tragic $36,424 |
| Immigrants | Caribbean | 0.1 /100 | #279 | Tragic $36,414 |
| Iroquois | 0.1 /100 | #280 | Tragic $36,408 |
| Spanish Americans | 0.1 /100 | #281 | Tragic $36,391 |
| Haitians | 0.1 /100 | #282 | Tragic $36,374 |
| Immigrants | Haiti | 0.1 /100 | #283 | Tragic $36,203 |
| Indonesians | 0.1 /100 | #284 | Tragic $36,140 |
| Paiute | 0.1 /100 | #285 | Tragic $36,056 |
| Osage | 0.0 /100 | #286 | Tragic $36,034 |
| Immigrants | Nicaragua | 0.0 /100 | #287 | Tragic $36,023 |
| Immigrants | Zaire | 0.0 /100 | #288 | Tragic $36,017 |
| Bangladeshis | 0.0 /100 | #289 | Tragic $35,960 |
| Central American Indians | 0.0 /100 | #290 | Tragic $35,930 |
| Blackfeet | 0.0 /100 | #291 | Tragic $35,864 |