Spaniard vs Immigrants from Africa Associate's Degree
COMPARE
Spaniard
Immigrants from Africa
Associate's Degree
Associate's Degree Comparison
Spaniards
Immigrants from Africa
45.2%
ASSOCIATE'S DEGREE
20.4/ 100
METRIC RATING
202nd/ 347
METRIC RANK
46.8%
ASSOCIATE'S DEGREE
63.2/ 100
METRIC RATING
162nd/ 347
METRIC RANK
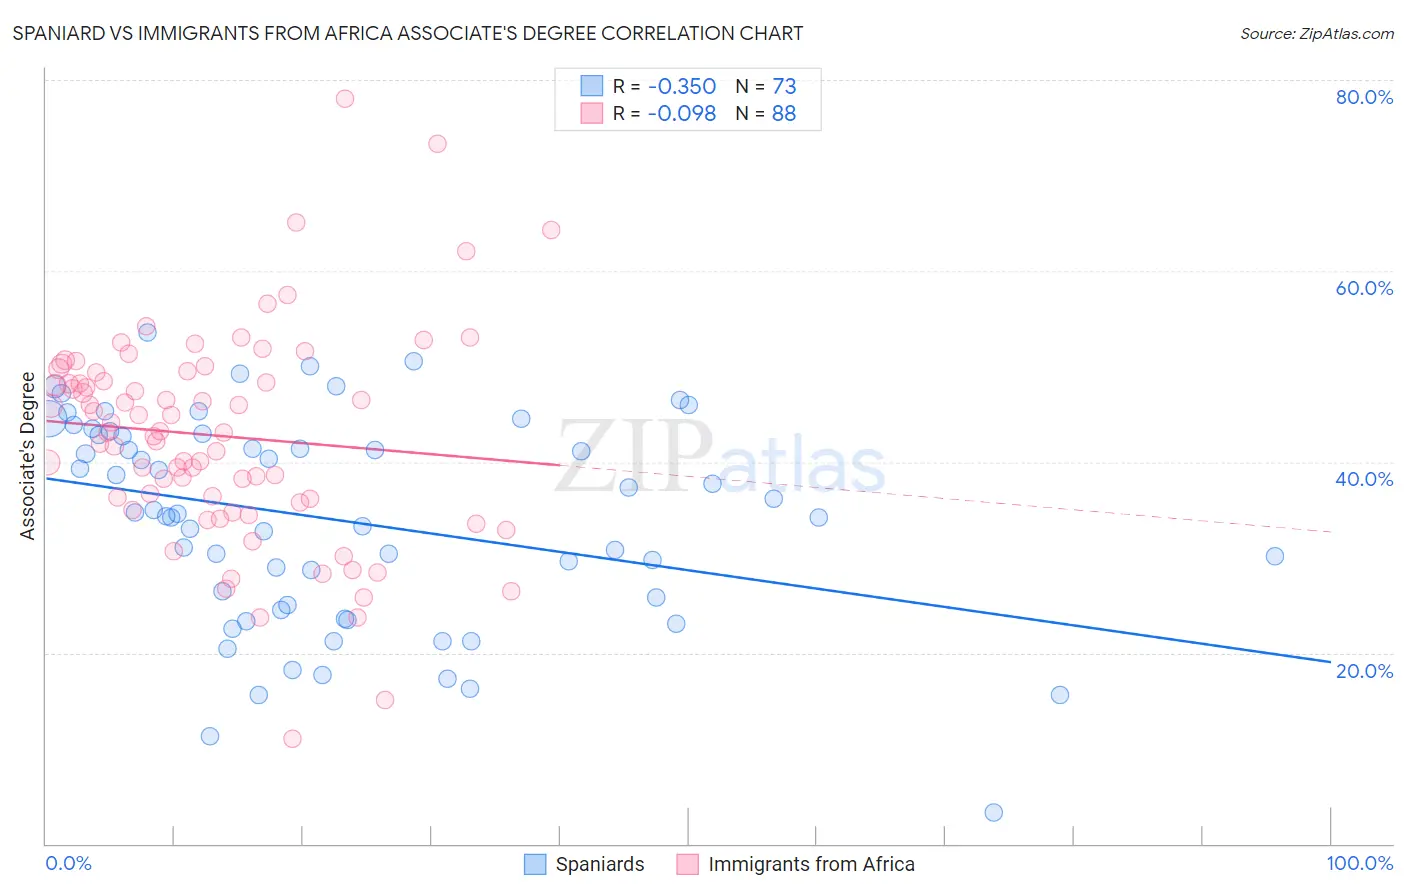
Spaniard vs Immigrants from Africa Associate's Degree Correlation Chart
The statistical analysis conducted on geographies consisting of 443,508,579 people shows a mild negative correlation between the proportion of Spaniards and percentage of population with at least associate's degree education in the United States with a correlation coefficient (R) of -0.350 and weighted average of 45.2%. Similarly, the statistical analysis conducted on geographies consisting of 469,405,809 people shows a slight negative correlation between the proportion of Immigrants from Africa and percentage of population with at least associate's degree education in the United States with a correlation coefficient (R) of -0.098 and weighted average of 46.8%, a difference of 3.6%.
Associate's Degree Correlation Summary
| Measurement | Spaniard | Immigrants from Africa |
| Minimum | 3.3% | 11.0% |
| Maximum | 53.6% | 78.0% |
| Range | 50.2% | 67.0% |
| Mean | 33.8% | 42.7% |
| Median | 34.5% | 43.2% |
| Interquartile 25% (IQ1) | 24.7% | 35.9% |
| Interquartile 75% (IQ3) | 42.8% | 49.4% |
| Interquartile Range (IQR) | 18.1% | 13.5% |
| Standard Deviation (Sample) | 10.9% | 11.2% |
| Standard Deviation (Population) | 10.8% | 11.2% |
Similar Demographics by Associate's Degree
Demographics Similar to Spaniards by Associate's Degree
In terms of associate's degree, the demographic groups most similar to Spaniards are Immigrants from South Eastern Asia (45.2%, a difference of 0.020%), Immigrants from Vietnam (45.2%, a difference of 0.050%), Senegalese (45.2%, a difference of 0.080%), Immigrants from Senegal (45.2%, a difference of 0.090%), and Immigrants from Bangladesh (45.2%, a difference of 0.11%).
| Demographics | Rating | Rank | Associate's Degree |
| Germans | 26.5 /100 | #195 | Fair 45.5% |
| French | 25.6 /100 | #196 | Fair 45.4% |
| Scotch-Irish | 22.3 /100 | #197 | Fair 45.3% |
| Immigrants | Bangladesh | 21.3 /100 | #198 | Fair 45.2% |
| Immigrants | Senegal | 21.2 /100 | #199 | Fair 45.2% |
| Senegalese | 21.1 /100 | #200 | Fair 45.2% |
| Immigrants | Vietnam | 20.8 /100 | #201 | Fair 45.2% |
| Spaniards | 20.4 /100 | #202 | Fair 45.2% |
| Immigrants | South Eastern Asia | 20.2 /100 | #203 | Fair 45.2% |
| Nigerians | 19.1 /100 | #204 | Poor 45.1% |
| Immigrants | Thailand | 18.9 /100 | #205 | Poor 45.1% |
| German Russians | 18.9 /100 | #206 | Poor 45.1% |
| Panamanians | 18.4 /100 | #207 | Poor 45.1% |
| Dutch | 17.6 /100 | #208 | Poor 45.0% |
| Immigrants | Costa Rica | 16.7 /100 | #209 | Poor 45.0% |
Demographics Similar to Immigrants from Africa by Associate's Degree
In terms of associate's degree, the demographic groups most similar to Immigrants from Africa are Somali (46.8%, a difference of 0.060%), Colombian (46.8%, a difference of 0.060%), Scandinavian (46.9%, a difference of 0.16%), Scottish (46.9%, a difference of 0.18%), and Immigrants from South America (46.7%, a difference of 0.26%).
| Demographics | Rating | Rank | Associate's Degree |
| Kenyans | 70.6 /100 | #155 | Good 47.1% |
| South Americans | 70.5 /100 | #156 | Good 47.1% |
| Sudanese | 70.3 /100 | #157 | Good 47.1% |
| Immigrants | Germany | 69.7 /100 | #158 | Good 47.1% |
| Immigrants | Poland | 69.2 /100 | #159 | Good 47.1% |
| Scottish | 65.4 /100 | #160 | Good 46.9% |
| Scandinavians | 65.2 /100 | #161 | Good 46.9% |
| Immigrants | Africa | 63.2 /100 | #162 | Good 46.8% |
| Somalis | 62.5 /100 | #163 | Good 46.8% |
| Colombians | 62.4 /100 | #164 | Good 46.8% |
| Immigrants | South America | 59.9 /100 | #165 | Average 46.7% |
| Hungarians | 59.3 /100 | #166 | Average 46.7% |
| Immigrants | Sierra Leone | 59.2 /100 | #167 | Average 46.7% |
| Immigrants | Somalia | 55.5 /100 | #168 | Average 46.5% |
| Uruguayans | 55.4 /100 | #169 | Average 46.5% |