Indonesian vs Australian Wage/Income Gap
COMPARE
Indonesian
Australian
Wage/Income Gap
Wage/Income Gap Comparison
Indonesians
Australians
22.7%
WAGE/INCOME GAP
99.9/ 100
METRIC RATING
69th/ 347
METRIC RANK
28.2%
WAGE/INCOME GAP
0.3/ 100
METRIC RATING
290th/ 347
METRIC RANK
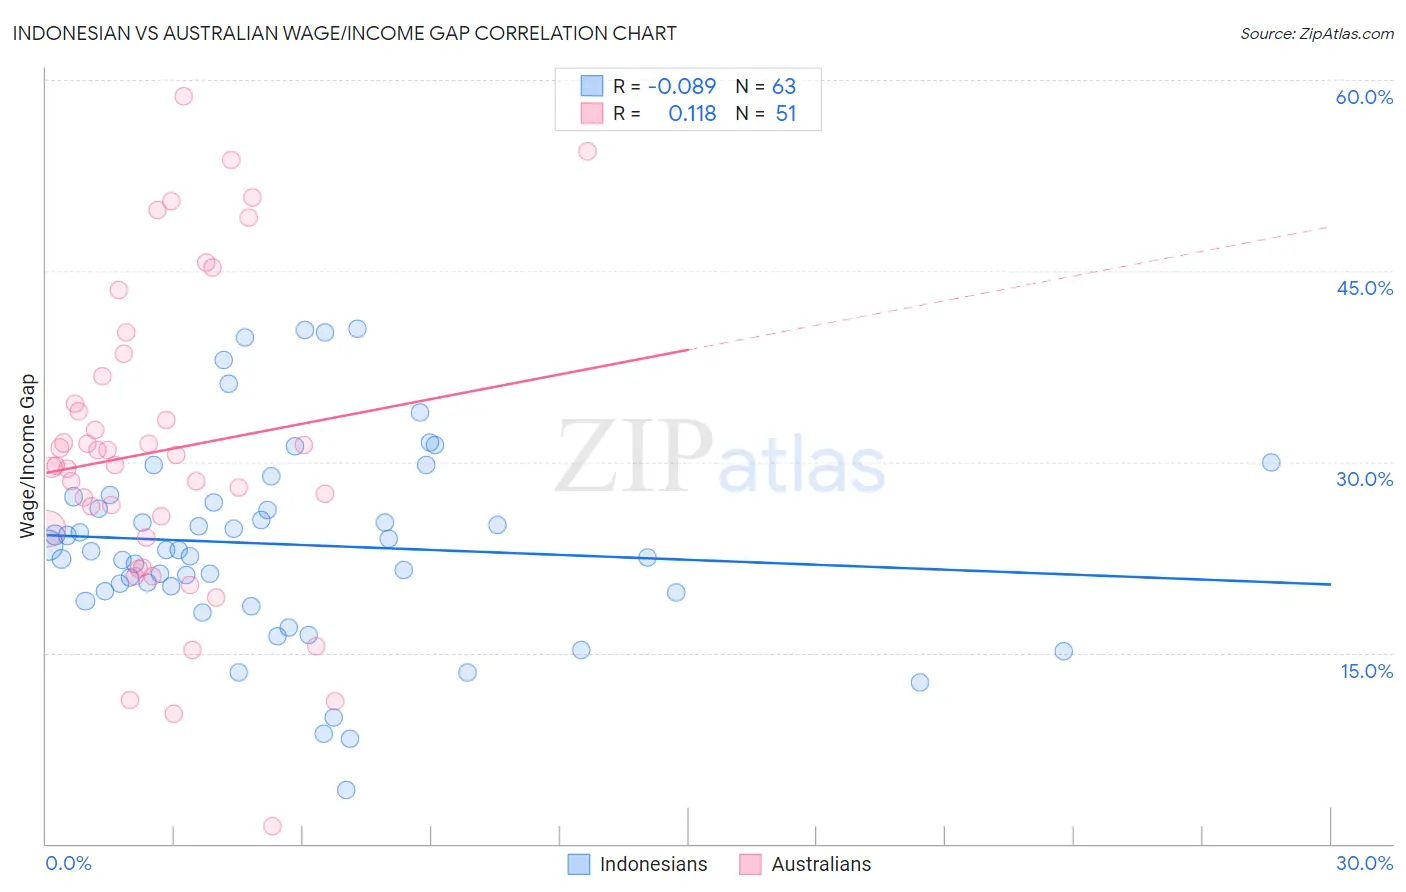
Indonesian vs Australian Wage/Income Gap Correlation Chart
The statistical analysis conducted on geographies consisting of 162,719,006 people shows a slight negative correlation between the proportion of Indonesians and wage/income gap percentage in the United States with a correlation coefficient (R) of -0.089 and weighted average of 22.7%. Similarly, the statistical analysis conducted on geographies consisting of 224,081,810 people shows a poor positive correlation between the proportion of Australians and wage/income gap percentage in the United States with a correlation coefficient (R) of 0.118 and weighted average of 28.2%, a difference of 24.0%.
Wage/Income Gap Correlation Summary
| Measurement | Indonesian | Australian |
| Minimum | 4.2% | 1.3% |
| Maximum | 40.4% | 58.7% |
| Range | 36.2% | 57.4% |
| Mean | 23.5% | 30.9% |
| Median | 23.1% | 29.8% |
| Interquartile 25% (IQ1) | 19.8% | 24.1% |
| Interquartile 75% (IQ3) | 27.3% | 36.7% |
| Interquartile Range (IQR) | 7.5% | 12.6% |
| Standard Deviation (Sample) | 7.8% | 12.2% |
| Standard Deviation (Population) | 7.7% | 12.1% |
Similar Demographics by Wage/Income Gap
Demographics Similar to Indonesians by Wage/Income Gap
In terms of wage/income gap, the demographic groups most similar to Indonesians are Immigrants from Nigeria (22.7%, a difference of 0.030%), Menominee (22.7%, a difference of 0.040%), Immigrants from Uzbekistan (22.7%, a difference of 0.11%), Central American Indian (22.7%, a difference of 0.21%), and Immigrants from El Salvador (22.8%, a difference of 0.28%).
| Demographics | Rating | Rank | Wage/Income Gap |
| Immigrants | Guatemala | 100.0 /100 | #62 | Exceptional 22.5% |
| Immigrants | Ecuador | 100.0 /100 | #63 | Exceptional 22.5% |
| Spanish American Indians | 100.0 /100 | #64 | Exceptional 22.5% |
| Guatemalans | 99.9 /100 | #65 | Exceptional 22.6% |
| Central American Indians | 99.9 /100 | #66 | Exceptional 22.7% |
| Menominee | 99.9 /100 | #67 | Exceptional 22.7% |
| Immigrants | Nigeria | 99.9 /100 | #68 | Exceptional 22.7% |
| Indonesians | 99.9 /100 | #69 | Exceptional 22.7% |
| Immigrants | Uzbekistan | 99.9 /100 | #70 | Exceptional 22.7% |
| Immigrants | El Salvador | 99.9 /100 | #71 | Exceptional 22.8% |
| Sub-Saharan Africans | 99.9 /100 | #72 | Exceptional 22.8% |
| Immigrants | Eastern Africa | 99.9 /100 | #73 | Exceptional 22.8% |
| Immigrants | Burma/Myanmar | 99.9 /100 | #74 | Exceptional 22.8% |
| Fijians | 99.9 /100 | #75 | Exceptional 22.9% |
| Ecuadorians | 99.9 /100 | #76 | Exceptional 22.9% |
Demographics Similar to Australians by Wage/Income Gap
In terms of wage/income gap, the demographic groups most similar to Australians are Czechoslovakian (28.2%, a difference of 0.070%), Canadian (28.1%, a difference of 0.090%), Immigrants from Australia (28.2%, a difference of 0.12%), Choctaw (28.1%, a difference of 0.13%), and Okinawan (28.1%, a difference of 0.16%).
| Demographics | Rating | Rank | Wage/Income Gap |
| French Canadians | 0.4 /100 | #283 | Tragic 28.1% |
| Immigrants | Sweden | 0.4 /100 | #284 | Tragic 28.1% |
| Italians | 0.4 /100 | #285 | Tragic 28.1% |
| Immigrants | Austria | 0.4 /100 | #286 | Tragic 28.1% |
| Okinawans | 0.4 /100 | #287 | Tragic 28.1% |
| Choctaw | 0.4 /100 | #288 | Tragic 28.1% |
| Canadians | 0.3 /100 | #289 | Tragic 28.1% |
| Australians | 0.3 /100 | #290 | Tragic 28.2% |
| Czechoslovakians | 0.3 /100 | #291 | Tragic 28.2% |
| Immigrants | Australia | 0.3 /100 | #292 | Tragic 28.2% |
| Immigrants | Israel | 0.3 /100 | #293 | Tragic 28.2% |
| Greeks | 0.3 /100 | #294 | Tragic 28.2% |
| Slovenes | 0.3 /100 | #295 | Tragic 28.3% |
| Northern Europeans | 0.3 /100 | #296 | Tragic 28.3% |
| Immigrants | North America | 0.2 /100 | #297 | Tragic 28.4% |